Benefits achieved by major infrastructure projects: a case study on the Bruce Highway
The Queensland Department of Transport and Main Roads (TMR) engaged ARRB via the National Asset Centre of Excellence (NACoE) program to undertake project R104 to evaluate the impacts of smart motorway treatments on the Bruce Highway and three other infrastructure projects in the vicinity of the study area.
The Queensland Department of Transport and Main Roads (TMR) engaged ARRB via the National Asset Centre of Excellence (NACoE) program to undertake project R104 to evaluate the impacts of smart motorway treatments on the Bruce Highway and three other infrastructure projects in the vicinity of the study area. The objectives of the evaluation were to:
Better understand the past and current economic cost of excessive congestion (CoC) on the Bruce Highway.
Evaluate the effectiveness of smart motorway treatments that were implemented progressively for inbound traffic on the Bruce Highway since 2015.
Assess the potential impacts of a series of major infrastructure projects between 2016 and 2018 on the performance of the Bruce Highway southbound (citybound) and the broader road network.
The study results can also assist in determining the effectiveness of past investments, inform future investments and benchmark performance.
Scope and method
A 24 km section of the Bruce Highway (which connects Brisbane with the north), between Bribie Island Road and South Pine River Bridge, was selected as the study site. Four major infrastructure projects relevant to the Bruce Highway, which included smart motorway treatments and response strategies, were identified for benefit evaluations as follows:
Ramp metering, variable speed limit (VSL) and automatic queue detection and queue protection (QDQP) systems .
Boundary Road interchange upgrade.
Gateway Upgrade North (GUN).
Redcliffe Peninsula Rail Line (RPRL).
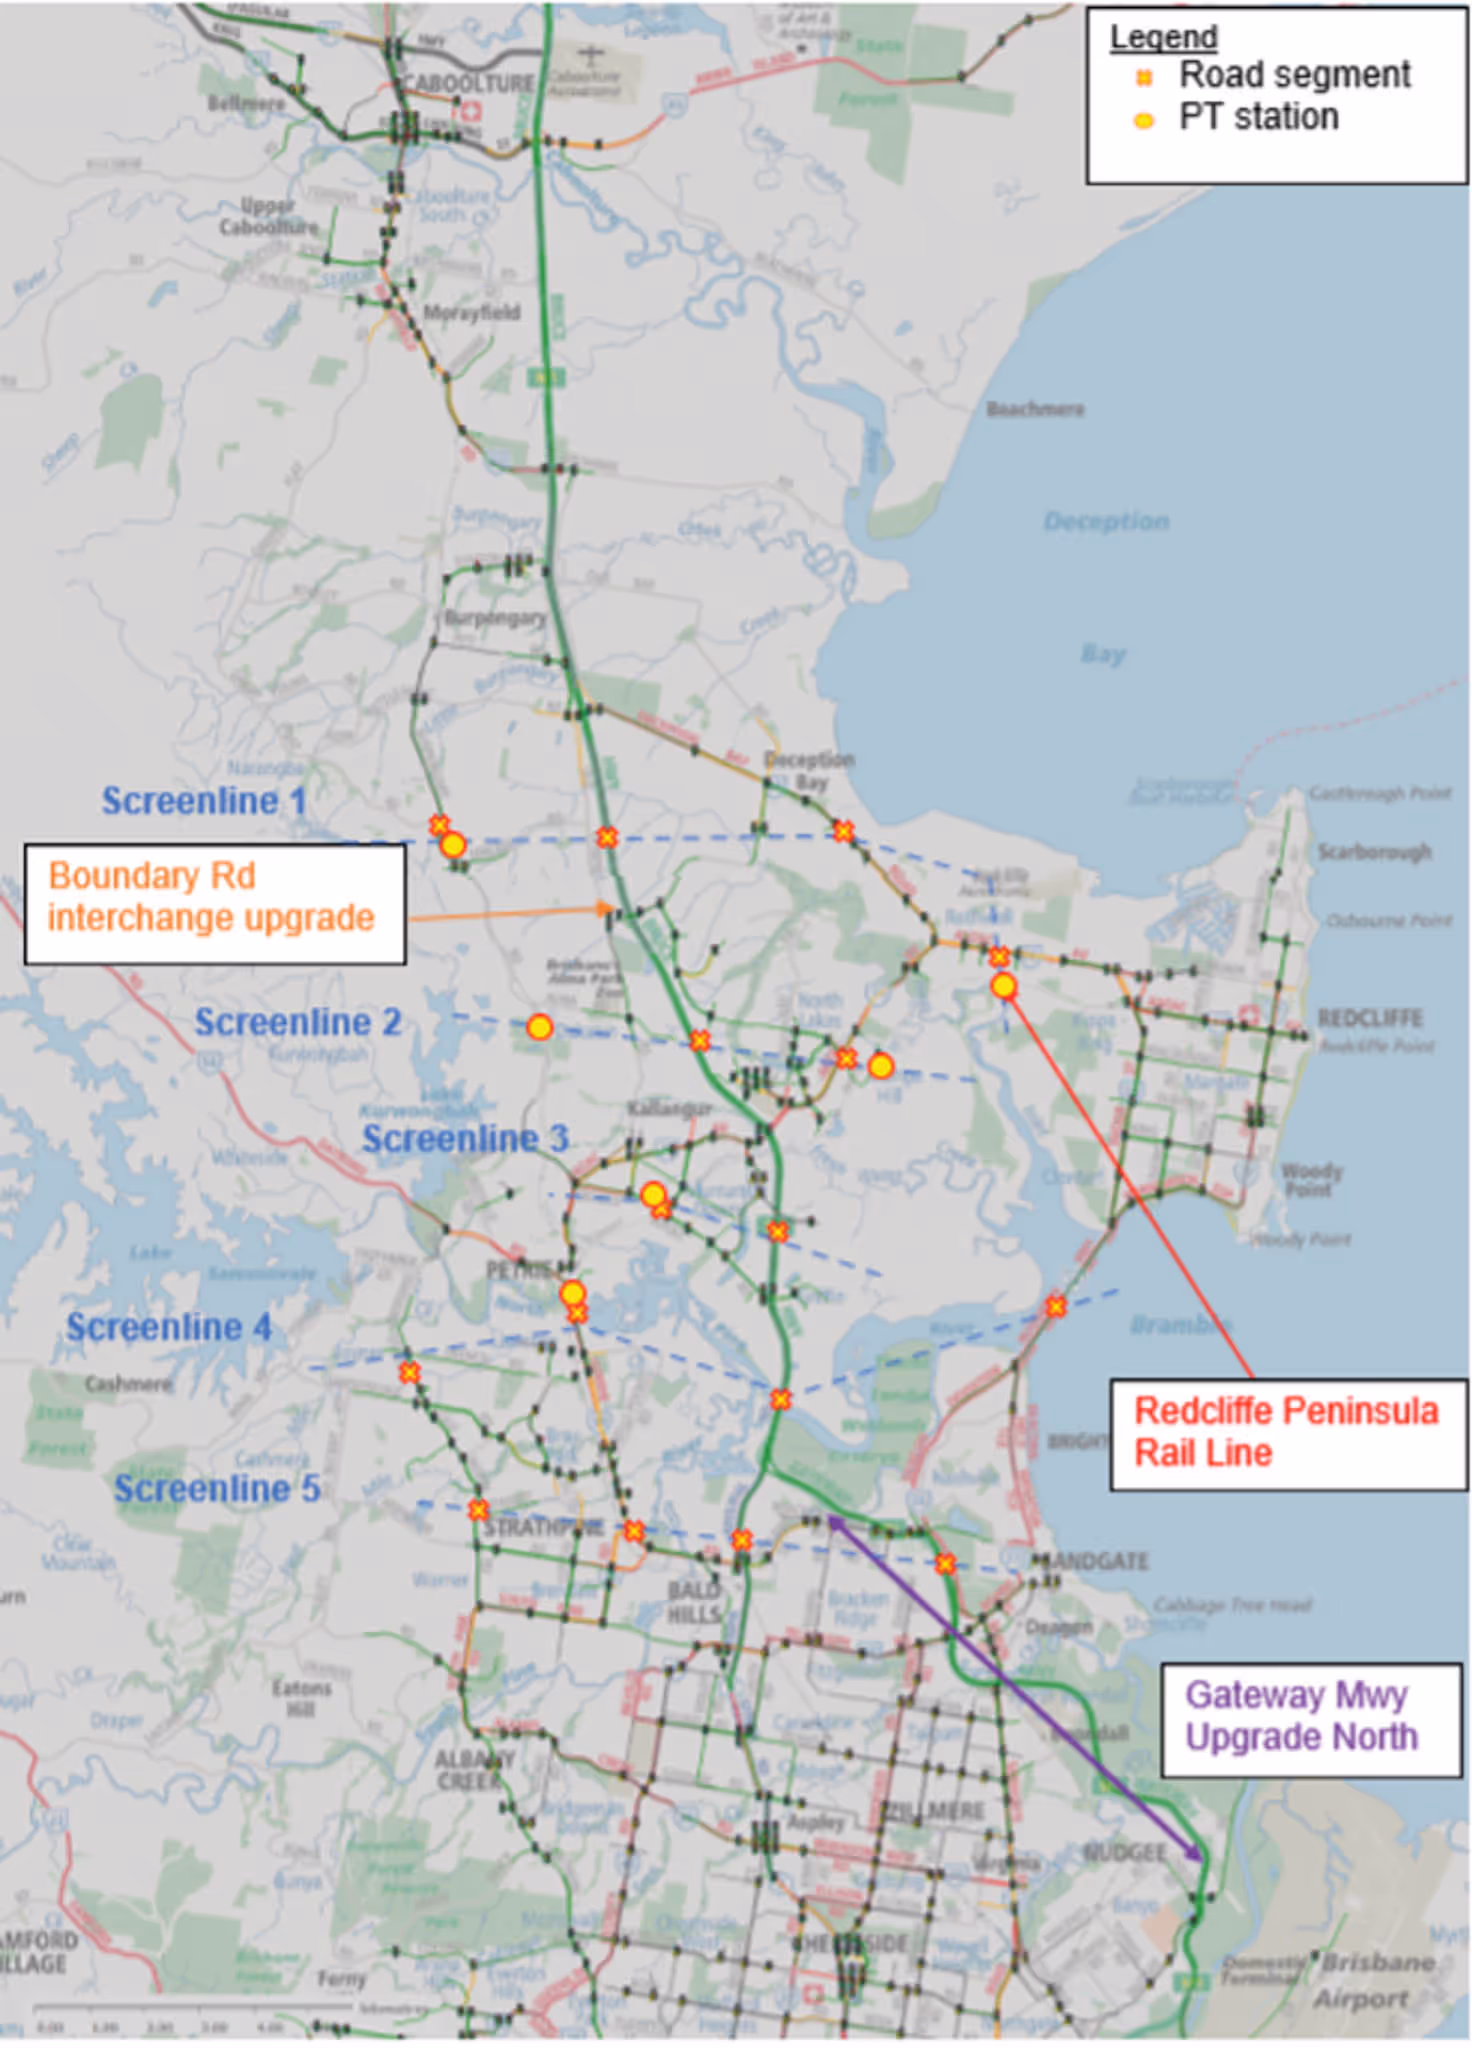
Figure 1 shows the location of the Bruce Highway study area and the major infrastructure projects.
Figure 1: Study area/corridors of concern
This assessment was conducted in two parts:
Part 1: Bruce Highway traffic performance evaluation. This focused on the before-and-after comparison for the Bruce Highway southbound to assess the individual impacts of the first three projects listed above.
Part 2: Travel choice changes investigation. This investigated how the infrastructure works influenced mode choices and their impact on the Bruce Highway and the broader road network, focusing particularly on evaluation of the RPRL and GUN projects.
In this paper, the total congestion cost is defined as the sum of excessive delay cost and travel time reliability cost. Other congestion cost components, such as environmental costs and vehicle operating costs, are not relevant to the travel time reliability measurement. They have been researched and implemented in TMR cost-of-congestion practices but were out-of-scope for this project.
Data specifications
For Part 1, Bruce Highway speed and flow data from January 2015 to December 2019 along the selected study site were extracted from the STREAMS National Performance Indicator (NPI) system. This covered a total of 18 road links for the analysis of congestion cost. Data cleansing and gap filling were then conducted to ensure high quality data. Vehicle composition data between 2015 and 2019 from traffic classification counters were also used as to cover the multi-modal CoC evaluation.
For Part 2, TransLink provided monthly average public transport ridership data for the bus routes and rail lines in the study area. A reference data set was also acquired for the same time period, containing the total public transport ridership for the remainder of South East Queensland (SEQ). In addition, daily traffic volume (flow) data in 15-minute intervals for all selected arterial road and motorway links were extracted from STREAMS. Annual population statistics for the suburbs in the study area were sourced from the Australian Bureau of Statistics. The study period of Part 2 was defined as June 2016 to December 2019, which was shorter than for Part 1, because sufficiently reliable data were available for this period only.
Highlights of key findings
Part 1 of the study focused on an analysis of average weekday peak period congestion cost between 5am and 10am, when the managed motorway was operating. The congestion cost reductions identified on the Bruce Highway southbound between 2015 and 2019 are as follows:
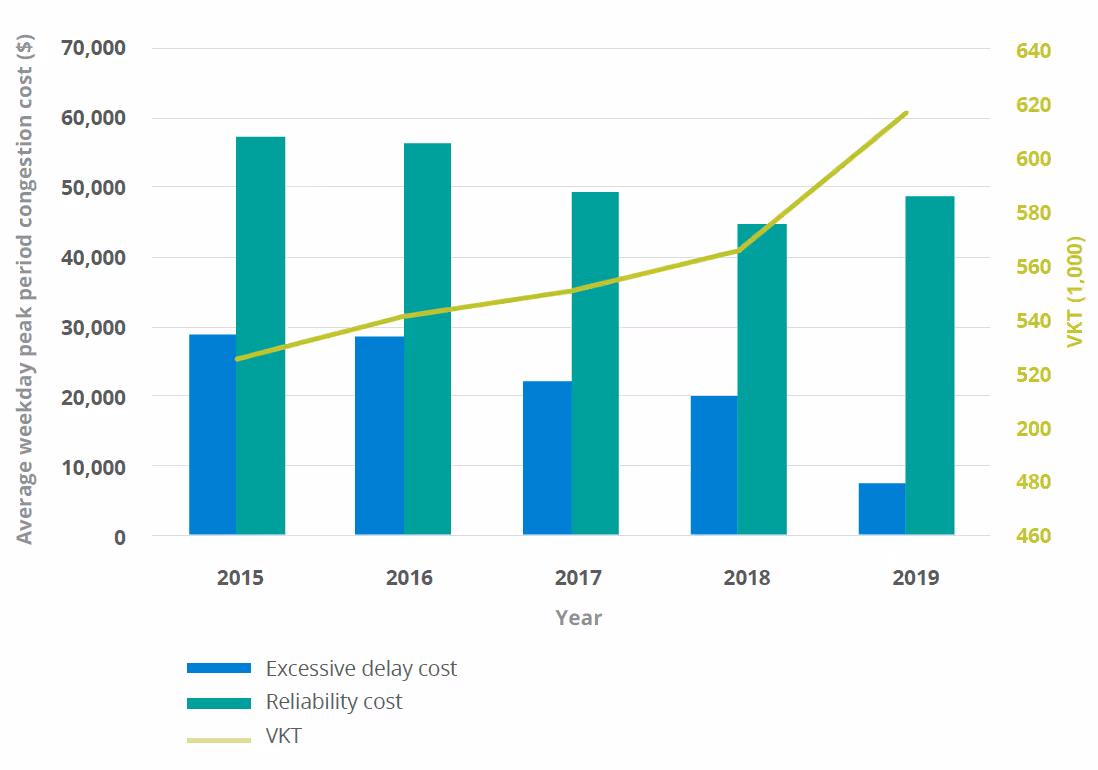
Although the average daily vehicle-kilometre-travelled (VKT) increased by 17% from 2015 to 2019 (see Figure 2 below), the peak period congestion cost was reduced by 35% on a typical weekday. The bulk of these cost savings originated from reduced excessive delay cost, which experienced a 74% reduction. The travel time reliability cost also reduced by 15%.
When normalising by VKT to account for the natural traffic growth over time, more significant cost savings were identified. Reductions of total congestion, excessive delay and reliability costs per VKT were found to be 45%, 78% and 28% respectively.
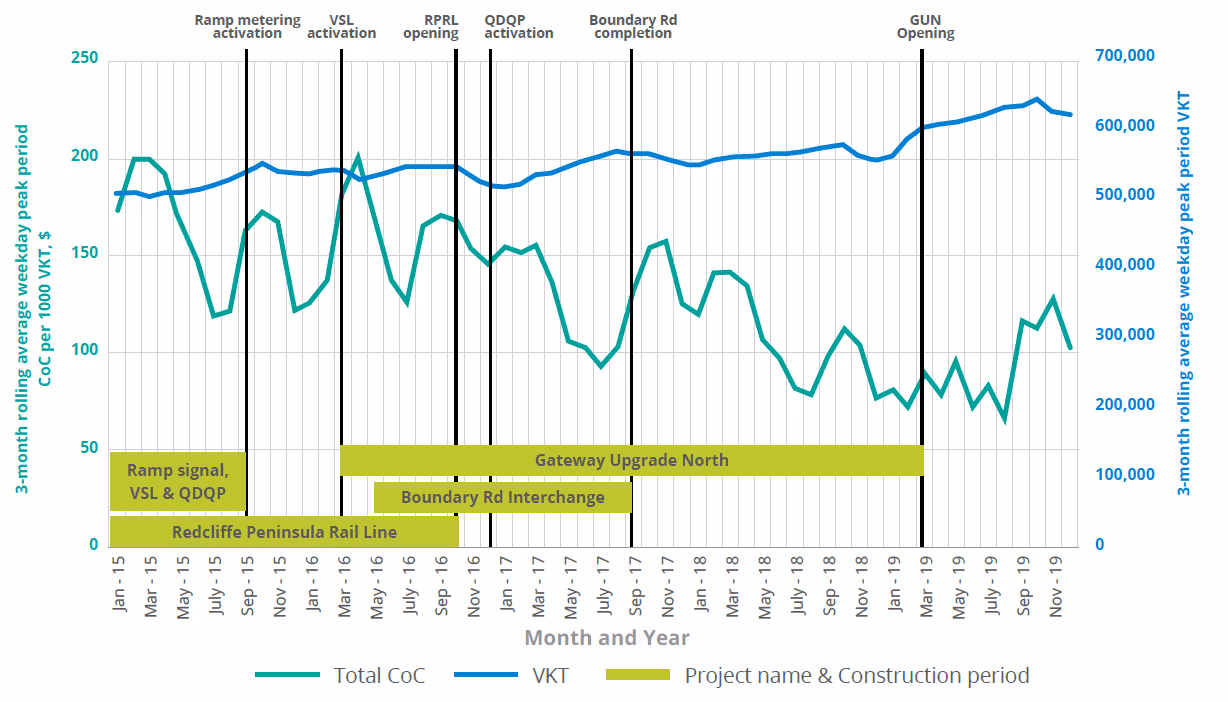
Figure 3 shows a holistic picture of the change in the three-month rolling average total congestion cost and VKT for the weekday peak period between 5am and 10am from 2015 to 2019, including the four major projects’ commissioning and construction time spans. Over the five years, the Bruce Highway demonstrated significant performance improvement and congestion cost reductions. A decreasing trend of congestion cost was observed as various infrastructure projects completed.
Figure 2: 2015-19 yearly congestion cost and VKT at Bruce Highway study site
Figure 3: 2015-19 average weekday normalised congestion cost, VKT and projects’ construction time span
Part 2 considered the changes in two modes of travel – private road usage (passenger vehicle occupants) and public transport (rail and bus passengers). The focus was on overall trends between 2016 and 2019 and on the impact of two of the major infrastructure projects, namely the completion of the GUN in early 2019 and the opening of the RPRL in October 2016. Five screenlines (SLs), as shown in Figure 1, were defined to capture traveller numbers at different parts of the road and rail network. Similar to Part 1, average weekday peak period traveller numbers were analysed. The key findings were:
Traveller numbers on the road and public transport networks in the study area increased over time. Between the first year of the study period (June 2016 to May 2017) and the last year of the study period (January 2019 to December 2019), traveller numbers across most SLs increased, with SL 3 showing the highest increase (17.6%).
The public transport mode-share gradually increased over time, which is demonstrated by a higher percentage of travellers using public transport between 2016 and 2018. The increase of public transport ridership in the study area was also higher compared to the South East Queensland (SEQ) average. Again, the differences were particularly noticeable on SL 3, where rail passenger volumes on the new RPRL grew up to 30.3% more than the average SEQ (relative change in March 2019 based on February 2017 baseline).
Conclusions
In general, findings from Part 1 and Part 2 are consistent, in particular those about the impact of the GUN project, which was investigated in both Part 1 and Part 2. The benefits and impacts of the four major infrastructure projects are summarised as follows:
1. Ramp metering, VSL and QDQP systems
It was observed from the data that the ramp metering, VSL and QDQP systems were best utilised and performed best when all systems were activated. For example, the before-and-after comparison (2015 versus 2017), where all ramp metering, VSL and QDQP systems were activated, revealed significant congestion reduction on the Bruce Highway. While there was still ongoing traffic disruption from the GUN project, after-period data revealed a 21% reduction in normalised excessive delay cost and a 23% reduction in both normalised reliability cost and total cost. QDQP added significant benefits to the Bruce Highway congestion reduction.
The implementation of ramp metering and the VSL and QDQP systems also increased the Bruce Highway’s operational capacity before the flow breakdown and maintained higher operational capacity after the flow breakdown.
2. Boundary Road interchange upgrade
Significant reduction in motorway congestion cost was observed from a before-and-after comparison (2016 versus 2018) for the links directly impacted by the upgrade. While the average weekday peak period VKT increased by 3%, the normalised excessive delay cost, reliability cost and total cost were reduced by 55%, 45% and 47% respectively. However, due to over-lapping of project time frames, a portion of the reduction in congestion cost should be attributed to the benefits of ramp metering and the VSL and QDQP systems.
3. GUN
Completion of the GUN project led to an operational capacity improvement, attracted a large increase in demand for the Bruce Highway southbound, and at the same time eased peak period congestion significantly. The comparison of the selected periods between 2018 and 2019 showed that while 2019 had an increase of 12% in average daily peak period VKT for the links directly impacted by the GUN, the normalised excessive delay cost and total costs reduced by 67% and 17% respectively. However, the completion of the GUN also led to a stagnation of public transport usage in the study area, despite consistent population growth.
4. RPRL
Following the opening of the RPRL in October 2016, an instant shift towards a higher public transport (rail) mode share was observed. Comparing June to August 2016 (before-period) to June to August 2017 (after-period), the mode share at SL 3 increased from 0.1% to 5.7% (+5.6%). This trend of above-average values for the RPRL continued into 2018. The mode share shifts at the other SLs were lower (+1.4% to +3.9%), but also increased, indicating an uptake of public transport usage. It is concluded that the above average figures for the RPRL were due to the particularly high population growth near the new RPRL (SL 3), as well as the availability of the new rail line with its increased capacity, and the truncation/rerouting of bus services.
As part of the project, ARRB also developed a beta version of a Bruce Highway CoC analysis Excel spreadsheet tool that enables fast processing of the before-and-after analyses. This tool can readily measure the excessive delay cost, reliability cost, average volumes, average speeds, vehicle delay and other key performance indicators on a link level or route level of the Bruce Highway study route.
References
Wu, K, Kochhan, R & Han, C 2020, Benefits achieved by major infrastructure projects in the study area of Bruce Highway (2019/20), NACOE R104, Final Report, Brisbane, Qld
Dr Clarissa Han
National Business Leader
NTRO
Dr Robert Kochhan
Senior Engineer
NTRO
Kevin Wu
Senior Engineer
NTRO
Dr Merle Wood
Principal Traffic Engineer
Queensland Department of Transport and Main Roads
Frans Dekker
Principal Traffic Engineer
Queensland Department of Transport and Main Roads
Interiew
Benefits achieved by major infrastructure projects: a case study on the Bruce Highway