Preventive Maintenance of Airport Pavements with the Traffic Speed Deflectometer
Maintaining airport pavements is becoming ever more challenging. Increased air traffic and aircraft sizes are putting even higher strains on the pavements. As a result, more attention is being given to how well airport pavements hold up and how their condition can be assessed.
Maintaining airport pavements is becoming ever more challenging. Increased air traffic and aircraft sizes are putting even higher strains on the pavements. As a result, more attention is being given to how well airport pavements hold up and how their condition can be assessed. Regular evaluations of all paved areas, such as runways, aprons and taxiways, are crucial, particularly for regional and seasonal airports that have limited budgets for maintenance. Unexpected airport closures due to poor pavement conditions can lead to significant financial losses and disrupt the mobility of the surrounding community.
For many years, the Heavy Weight Deflectometer (HWD) and the Falling Weight Deflectometer (FWD) have been used to assess pavement conditions. However, HWD measurements are slow and require the area being checked to be closed off, making the process time-consuming for airport management. Moreover, it only assesses a few spots, which means it may miss local issues or weak areas. Similar challenges in road management have led to the use of the Traffic Speed Deflectometer (TSD) for assessing pavement conditions over larger areas (Nielsen & Jensen 2022). Thanks to advancements in TSD technology, including high-frequency Doppler sensors, it's now easier to measure the condition of all paved areas in airports.
This paper presents the results of TSD measurement campaigns conducted at various airports across Europe, covering different pavement types. The structural condition of runways, aprons, taxiways and parking lots is evaluated using a TSD-compatible model for analysing pavement behaviour (Nielsen 2019).
Traffic Speed Deflectometer
In recent years the TSD has gained interest as a new approach to measuring the structural condition of pavements (Krarup et al. 2006). The TSD utilises an innovative principle based on Doppler lasers, mounted on a beam installed in a truck, to measure the pavement response to a 10-tonne axle while driving at ordinary traffic speed. The Doppler lasers measure the deflection velocities of the pavement at specific points and from knowing the driving speed of the vehicle, the slope of the deflection basin can be determined (Nielsen 2019).
From the deflection slopes it is possible to derive a great amount of information about the structural condition of the pavement. A back-calculation model has been specifically developed for TSD measurements, which takes the viscoelastic behaviour of the pavement under a moving load into account and can be used to determine the condition of the pavement (Nielsen 2019). An obstacle to the use of TSD at the project level was that the standard approaches to back calculation of pavement properties were based on the FWD systems. Therefore, the model was developed on both simulated and real TSD data. The back-calculation model has been validated at the Aurora instrumented road test site in Muonio, Finland, at a range of different driving speeds and road temperatures (Nielsen et al. 2022). The ability of the TSD to measure pavement surface response was validated with the in-situ displacement transducers. In addition, the stresses and strains from the viscoelastic back-calculation algorithm were compared with the in-situ transducers at the test site. An excellent agreement of surface response was observed between the two systems.
The deflection slope from each Doppler laser, along with the estimation of the layer thicknesses from the Ground Penetrating Radar (GPR) data, is used as the input for the back-calculation model to calculate the elastic moduli of the pavement in all layers, the tensile strain in the top layer, the vertical strain in the bottom layer and temperature compensated E-moduli.
Condition assessment in 3D
The TSD has been used to extensively measure the structural conditions of paved areas in various airports around Europe over the last few years. In 2019, a major airport had to shut down the runway for a couple of weeks due to a complete rehabilitation of a localised weak area. It had not been possible to predict the weak spots with the existing pavement performance evaluation and thus carry out the necessary preventive maintenance before the failure occurred. The shutdown of runway operation ended up costing the airport authority a little over a million dollars. This scenario initiated a project where the TSD was used to measure different pavement areas in the airport to create a full 3D map of the structural condition of the airport pavement, to help prevent future unpredicted failures.
Ex.1 – Top layer and strains
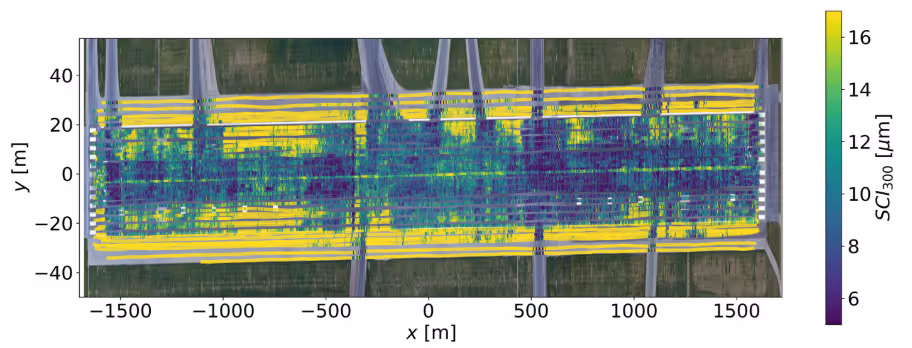
Runway04R-22L is one of the two main runways of Copenhagen airport, with a length of approximately 3 km and a width of 56 m, including 6 m of shoulder. The entire length and width of the runway was measured with a special resolution of 1 m in either direction, meaning that the TSD drove the length of the runway 56 times with 1 m in spacing between each run in the transverse direction and reported defection slopes in the longitudinal direction at 1 m intervals. TSD was calibrated at 60 km/h, as the maximum driving speed for taxiway is 60 km/h. Therefore, all paved areas were measured at 60 km/h.
The performance of the top layer can be quantified using the surface curvature index SCI300, which is defined as the difference in deflection between the load position and 300 mm away from this point (Pigozzi et al. 2014). The curvature of the deflection basin is related to the horizontal strain in the bottom of the asphalt layer, which is an indicator of fatigue damage on the pavement, meaning that higher values for SCI300 indicates a weaker pavement. In Figure 1, SCI300 at 1m interval is presented for the airport runway (Nielsen & Jensen 2022).
The SCI300 values observed in the runway are mostly in the range of 5 µm to 25 µm except the shoulder area, which means that the pavement is very stiff, as airport runways tend to be to withstand the very heavy loads from the planes. The SCI300 in the shoulder area is weaker than the rest of the runway, as is expected.
There are a few interesting phenomena that can be observed from Figure 1. Even though the touchdown approach from left side is only 2% of the total touchdown traffic on this airport runway, the area around -800 m in the x-axis and +/- 20 m on the y-axis has weak spots. This could be not only due to air traffic but other pavement characteristics resulting in lower SCI300 values. It is also evident that areas where the taxiways are connected to the airport runway are stiffer and have relatively low SCI300 values. This is due to the strengthening of pavement to withstand air traffic with lower driving speeds.
Figure 1: SCI300 mapping of an airport runway section. Data collected at a driving speed of 60 km/h, with 1 m spatial resolution (Nielsen & Jensen 2022).
Ex. 2 – Analysis of all layers
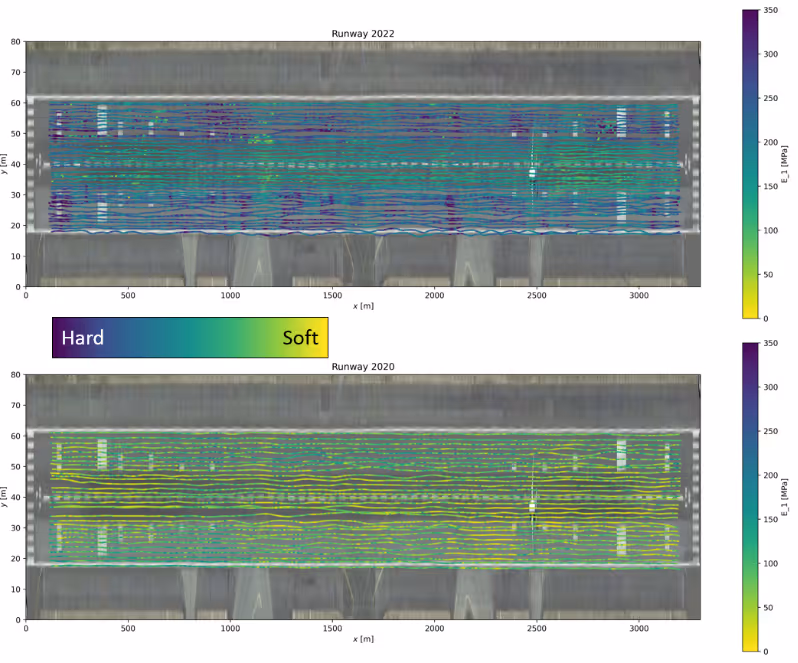
Using the Viscoelastic back-calculation model described earlier (Nielsen 2019), it is possible to estimate the Elastic moduli for different pavement layers, including the subgrade. The deflection slopes and the layer thicknesses estimated from GPR data is used as input for the back-calculation model. There was a project done on another airport runway in 2020 and 2022. A 3D mapping of Elastic moduli was done for 3 layers – asphalt layer, subbase layer and subgrade layer.
It should be noted that the pavement surface temperature in 2020 was between 20 and 40 °C and the pavement surface temperature in 2022 was between 7 and 11 °C. Therefore, a temperature compensation was performed to normalize both measurements to 20 °C. The temperature compensated subgrade E-modulus from both years can be found in Figure 2.
One of the interesting phenomena from the comparison was that the overall Elastic moduli of the subgrade in 2020 was lower than in 2022, when the reverse scenario was expected. Upon discussion with the airport authorities, it was found out that the airport authority had upgraded the drainage system surrounding the runway in 2021. This means that there was a lower water content in the subgrade in 2022, thus resulting in a lower elastic modulus in 2020. The repair work done in 2021 had helped in strengthening the subgrade as evident from the results of 2022.
Figure 2: 3D mapping of subgrade elastic moduli, in an airport runway taken in 2020 and 2022. Data collected at a driving speed of 60 km/h, with 1 m spatial resolution (Arokia & Haakonsson 2022).
Ex. 3 – Finding High Risk Areas
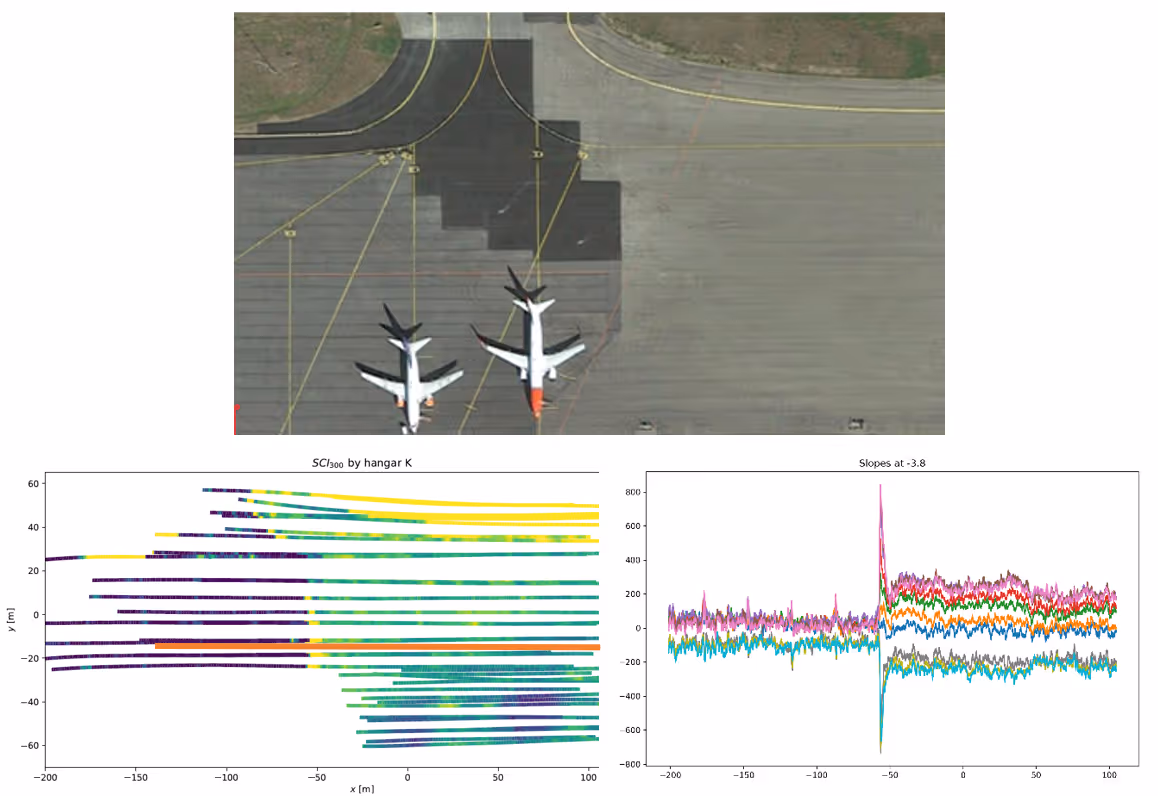
In 2019, TSD measurements were undertaken on an apron in another airport with concrete slabs covered with asphalt. Figure 3 shows the SCI300 mapping of the parking area. The measurements were made at a driving speed of 60 km/h. From the graph, it is evident that there are two distinct areas in the pavement. One is a stiff area with predominantly blue colour and this area is a newly rehabilitated section. The other area is a weak area with predominantly green colour and this area is an old section. TSD was able to detect the joints signatures on both sections where the concrete slabs had a length of 30 m. The alarming phenomena in this parking area is the place connecting the old section and the newly rehabilitated section. There were weak joints along the -50 m mark on the x-axis. This informed the airport authorities to strengthen this area to prevent further deterioration.
Figure 3: SCI300 is used to show the transition between new pavement and old (bottom left). As seen in the profile plot (bottom right) it has a sharp peak, which means a lot of strain is put on the pavement here, potentially leading to cracking and, later, material chipping off.
A historical view
One of the airports has been a recurring client, consistently procuring TSD data for their runway. As a result, data is available from 2020, 2022 and 2024. This data is valuable for tracking both overall runway changes and specific areas where significant shifts have occurred.
Analyzing the distribution of E-moduli (a measure of stiffness) over the years provides a broad picture of the runway’s condition. Figure 4 illustrates the historical development of the three-layer structure of the runway (subgrade, base and asphalt) through boxplot and histogram plots.
In the top plots (subgrade), both Figure 4a (boxplot) and Figure 4b (histogram) reveals a steady decline in stiffness from 2020 to 2024. The boxplot in Figure 4a indicates that, in 2020, there was significant variability in subgrade conditions, as evidenced by the wide range of upper quartiles. By 2024, the peak value in the histogram shifts from around 102 MPa to lower values, confirming a deterioration in subgrade stiffness over time. The two peak modes indicate that there are two distinct features in the subgrade (geological).
The middle plots (base layer) in Figures 4a and 4b show a gradual decline in stiffness from 2020 to 2022, followed by stabilization in 2024. The histogram reflects a similar trend, with the base layer exhibiting consistent values by 2024, though not returning to its original 2020 levels. All the histogram exhibit a clear log-normal behaviour.
In the lower plots (asphalt), Figure 4a shows a slight decrease in stiffness in 2022, followed by a recovery in 2024. The histogram in Figure 4b displays a stable but fluctuating trend, indicating a decrease in stiffness by 2022 but an overall improvement in 2024. The number of outliers in this layer highlights irregularities, such as cracks, metallic debris and areas requiring repairs.
Overall, the data from both Figure 4a and Figure 4b illustrate significant changes in the runway’s condition, providing critical insights into its structural integrity over the years.
Figure 4: a) Boxplots of E-moduli’s of the subgrade (upper), base (middle) and asphalt (lower) from 2020, 2022 and 2024 from an airport runway. b) Histograms of the of the same values as in a, showing the distribution patterns of the data. The x-axis is in log scale and the y-axis in density, such as the area equals 1
Even better indices
Recently a new Surface curvature index for TSD data (SCITSD) was introduced, which is suited for rolling wheel deflectometer experiments such as TSD (Pehrsson et al. 2024). The index is compatible with previous methods developed for other instruments but exploits the fact that the TSD measures very close to the loading wheel where certain pavement failures often show.
The applications of SCITSD are to detect discontinuities, cracks, concrete joints and local weakness of pavement with great precision. Figure 5shows two sections of concrete pavement in the same airport, one before and one after repaving. As can be seen, the joint strength is a lot higher for the new pavement and thus gives much smaller peaks in SCITSD than the old pavement.
Figure 5: Comparison of SCITSD, from two sections of airport pavement, at 5 cm spatial resolution.
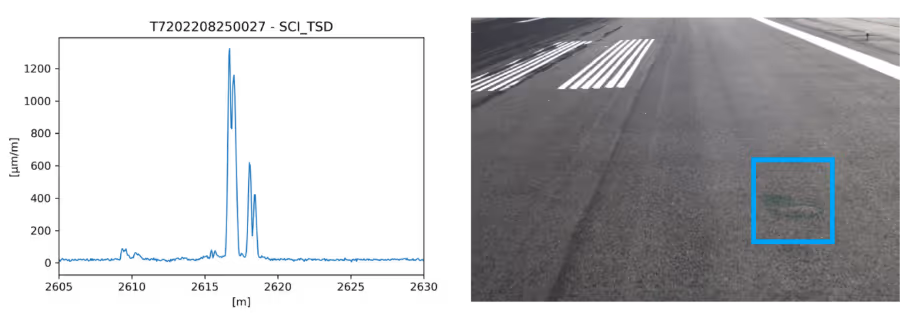
SCITSD can also be used for locating local weaknesses in the top layer of a pavement structure. This can be validated with measurements like Right of Way (ROW) camera images or GPR’s radargram data, whichare measured at the same time as the TSD data. Figure 6 shows a spike in the SCITSD values approximately 25 times more than the average SCITSD values. The ROW image shows the same location, where a small repair is clearly visible. This shows that the repair is not adequate and that the pavement is still significantly weaker at this spot. This same method can also be used to locate a small crack both on the surface or a crack starting to form at the bottom of the top layer.
Figure 6: Localised weakness detected by SCITSD and ROW camara (Arokia & Haakonsson 2022).
PCR estimation
Airport pavements are complex engineering structures (Federal Aviation Administration (FAA) 2016). Pavement analysis and design involves the interaction of four important components: the subgrade; the paving materials; the characteristics of applied loads; and climate. To protect airport pavements from overload, a pavement strength rating system and an aircraft load classification system are adopted (Sun et al. 2023).
The FAA has made a new Aircraft Classification Rating (ACR) and Pavement Classification Rating (PCR), to replace the older Aircraft Classification Number (ACN) to calculate and assess the aircraft loads and Pavement Classification Number (PCN) (Civil Aviation Safety Authority 2021). A lot of the airports around the world have been implementing the new standard since 2020.
According to the FAA (2022), the strength of the pavement is reported in terms of the load rating of the aircraft that the pavement can accept on an unrestricted basis. Unrestricted refers to the relationship of PCR to ACR, and it is permissible for an aircraft to operate without weight restriction when the PCR is greater than or equal to the ACR. Determination of the numerical PCR value for a particular pavement can be based upon one of two procedures the Aircraft method and the technical evaluation method.
Using the technical evaluation method the following information is vital for PCR estimation:
Aircraft traffic composition and frequency
Thickness and material type of each layer of pavement structure
Elastic modulus of subgrade.
Estimating the subgrade E-moduli is the complicated part of estimating PCR. This is where the TSD becomes a useful tool. In each measurement campaign, 3D mapping of subgrade E-moduli of TSD is performed with around 50 runs. The overall average subgrade E-moduli for the whole runway is used in the estimation of PCR. The subgrade E-moduli has a significant impact on the subgrade strength category of PCR.
Conclusion
Over the years, the TSD has proven effective in measuring various airport pavements including runways, taxiways and parking lots, especially those with very rigid or flexible surfaces. When TSD data is compared to traditional methods like HWD/FWD, it shows a strong match in results, particularly for the SCI300 parameter, which measures surface curvature.
Thanks to new high-frequency Doppler sensors in the TSD, it's now possible to create 3D maps of the structural condition of each pavement layer. This helps airport authorities make better decisions about maintenance and repairs. Another useful feature of TSD is its ability to detect issues like rutting, cracking and weakened concrete joints, even when the concrete is covered by an asphalt layer. Measuring with the TSD also provides knowledge of the pavement condition at a much higher resolution than FWD and HWD, using the same of fewer number of man hours.
One challenge has been estimating the PCR using TSD data, as the FAA’s standards are based on FWD/HWD data. However, using the TSD viscoelastic back-calculation model to estimate the subgrade E-moduli has shown promising results in estimating PCR. The next step will be to apply this approach to different airport runways to establish a solid link between PCR and TSD data on subgrade strength.
References
Arokia, M & Haakonsson, M 2022, ‘Visco-elastic back calculation on demand: A new era is here’, European road profile users’ group, 9th, 2022, Edinburgh, Scotland, European Road Profile Users’ Group (ERPUG).
Civil Aviation Safety Authority 2021, Strength rating of aerodrome pavements, Advisory Circular 139.C-07 v1.0, Civil Aviation Safety Authority, Australian Capital Territory, Australia.
Federal Aviation Administration 2016, Standardized method of reporting airport pavement strength-PCN, Advisory Circular AC No:150/5320-6F, U.S Department of Transportation, Washington, DC.
Federal Aviation Administration 2022, Standardized method of reporting airport pavement strength-PCR, Advisory Circular AC No:150/5335-5D, U.S Department of Transportation, Washington, DC.
Krarup, J, Rasmussen, S, Aagaard, L & Hjorth, PG 2006, ‘Output from the Greenwood traffic speed deflectometer’, ARRB conference, 22nd, 2006, Canberra, ACT, ARRB Group, Melbourne, VIC.
Maser, K, Schmalzer, P, Shaw, W & Carmichael, A 2017, ‘Integration of traffic speed deflectometer and ground-penetrating radar for network-level roadway structure evaluation’, Transportation Research Record, vol. 2639, no. 1, pp. 55–63, doi: 10.3141/2639-08.
Nielsen, CP 2019, ‘Visco-elastic back calculation of traffic speed deflectometer measurements’, Transportation Research Board Annual Meeting, 98th, 2019, Washington, DC, Transportation Research Board, Washington, DC.
Nielsen, CP 2020, ‘TSD measurements and data analysis: state of the art and new developments’, International Society of Asphalt Pavements conference, 13th, 2018, Fortaleza, Brazil, International Society of Asphalt Pavements (ISAP), Lino Lakes, MN, US.
Nielsen, CP & Jensen, K 2022, ‘Traffic speed deflectometer measurements at Copenhagen airport’, International Conference on the Bearing Capacity of Roads, Railways and Airfields, 11th, 2022, Trondheim, Norway, Norwegian University of Science and Technology.
Nielsen, CP, Varin, P, Saarenketo, T & Kolisoja, P 2022, ’Traffic speed deflectometer measurements at the Aurora instrumented road test site’, International Conference on the Bearing Capacity of Roads, Railways and Airfields, 11th, 2022, Trondheim, Norway, Norwegian University of Science and Technology.
Pehrsson, H, Malmgren-Hansen, D, Arokia, M & Grønskov, L 2024, ’SCITSD: A new structural curvature index for strain analysis of large road networks’, European Transport Research Review, vol. 16, in press.
Pigozzi, F, Portas, S, Coni, M & Maltinti, F 2014, ‘Implementation of deflection bowl measurements for structural evaluations at network level of airport pavement management system’, FAA worldwide airport technology transfer conference, 2014, Galloway, NJ, Federal Aviation Administration, Washington, DC.
Sun, J, Chai, G, Oh, E & Bell, P 2023, ‘A review of PCN determination of airport pavements using FWD/HWD test’, International Journal of Pavement Research and Technology, vol. 16, pp. 908–926, doi: 10.1007/s42947-022-00170-1.
Helene Pehrsson
Research and Development Engineer
Greenwood Engineering A/S
Dr David Malmgren-Hansen
CTO
Greenwood Engineering
Magnus Jørgensen
Research and Development Engineer
Greenwood Engineering
Interiew
Preventive Maintenance of Airport Pavements with the Traffic Speed Deflectometer
.avif)