Characterising pavement roughness using smartphone-collected vehicle response data
Roads are key to a nation's transportation and maintaining their condition is crucial for ensuring user safety and vehicle ride comfort. Monitoring pavement roughness is therefore essential for informed decision-making in maintenance planning and remedial works. As digital technologies advance, the monitoring of road roughness has begun to incorporate more ubiquitous sensing technologies.
This article was featured on NTRO on July 17, 2026
1. Introduction
Roads are key to a nation's transportation and maintaining their condition is crucial for ensuring user safety and vehicle ride comfort. Monitoring pavement roughness is therefore essential for informed decision-making in maintenance planning and remedial works. As digital technologies advance, the monitoring of road roughness has begun to incorporate more ubiquitous sensing technologies. In addition to conventional professional pavement survey instruments, public vehicles (i.e., vehicles owned by the general public) travelling on road networks can also serve this purpose. Pavement roughness causes vibrations in the vehicle body, which can be measured using smartphone sensors. These sensors have the potential to be a prevalent tool for collecting vehicle-based response data. However, smartphone-based systems are affected by variations in practical factors, including travelling speed, vehicle type and mounting configurations. These inconsistencies and uncertainties result in significant differences in measurements among different users. Hence, this research investigated the impact of these practical factors and developed methods for characterising pavement roughness considering these factors, by leveraging crowdsourced public vehicles.
We first developed a standardised evaluation framework to systematically assess the performance of three commercial smartphone-based roughness index estimation apps. Next, we investigated the impact of smartphone mounting configurations on smartphone-collected vehicle response data. A laboratory vibration test was conducted to obtain the response function of the mounting configurations. Frequency-domain correction functions were developed to mitigate their impact, which was evaluated in field tests. Subsequently, the research developed a method to estimate the roughness profile using vehicle body response sequences, taking into account vehicle parameters such as weight and suspension characteristics. Details are highlighted in the following sections.
2. Evaluating existing smartphone-based roughness estimation systems
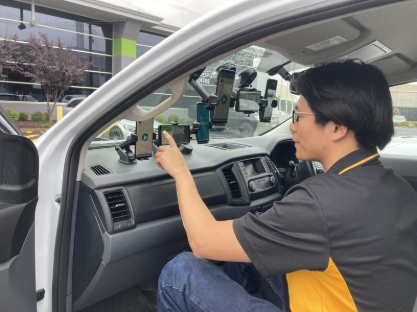
The review suggests that an understanding of the performance of the state-of-the-art smartphone-based roughness index estimation (sRIE) systems is lacking, with no standard procedures for validating their performance. Multiple sRIE systems have become available recently. However, there is no framework to evaluate the performance of sRIE systems in a systematic and repeatable manner. This work aimed to develop and validate a framework for evaluating sRIE systems for pavement roughness assessment. It is the first attempt to integrate practical factors that affect sRIE systems into the evaluation framework. Using these factors, an evaluation framework was established and the computation of the statistical test measures explained. A field experiment then evaluated three existing sRIE apps side-by-side, as shown in Figure 1 and Figure 2.
Figure 1: Evaluating the performance of the existing Apps
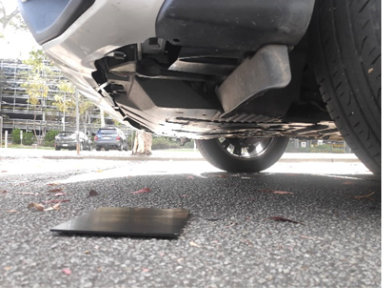
Figure 2: NTRO survey vehicle
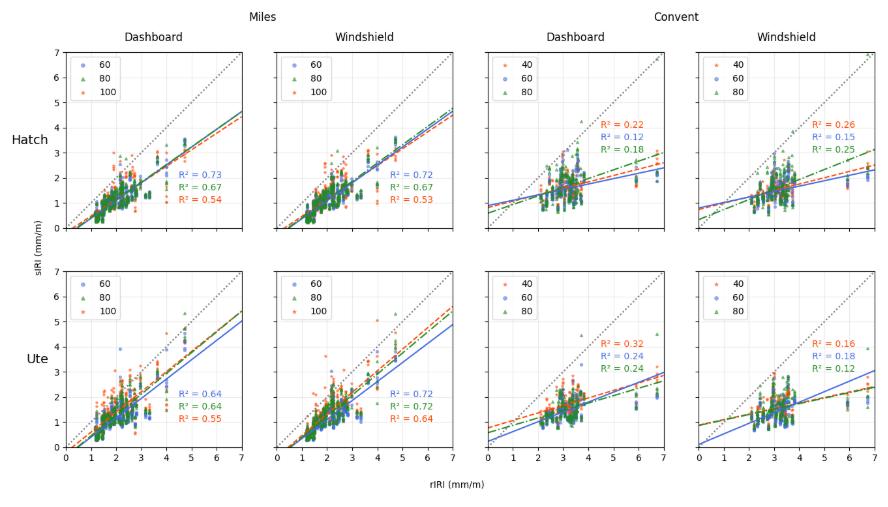
The proposed framework was used to validate the sRIE systems’ repeatability and accuracy against conventional measurement instruments. The statistical measures have shown that the sRIE systems’ performance becomes less robust when tested on gravel pavement. Two of the three sRIE systems depend on survey speed, vehicle type and mounting variations. However, the third system can provide consistent measurements regardless of practical factor variations, and the results are demonstrated in Figure 3.
Figure 3: Performance of the existing sRIE system (Yu, Fang & Wix, 2023)
The results have proved the validity of the proposed framework to assess the performance of the tested systems. The general performance of current sRIE systems was found to have an R2 value in the range of 0.5 to 0.7, when tested on sealed pavement. Building on these findings, the next section focuses on quantifying the impact of the mounting configuration on the response of the smartphone and developing a correction function to mitigate its impact.
3. Quantifying and mitigating the mounting-induced impact on the smartphone-collected vehicle response
The results from the field experiments of the existing sRIE Apps have shown that they do not consider the different systems used to mount the smartphone. As a result, the measurements obtained from different smartphone mountings are significantly inconsistent. Among the practical factors that affect the smartphone-collected data, the mounting type has been underexplored, despite its significant influence on the smartphone-collected vehicle response data.
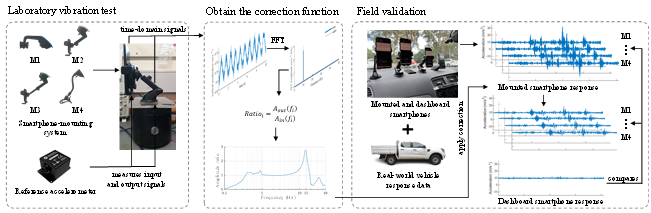
This section aims to quantify the effects of four typical mountings on smartphone-collected response data and develop a method to correct their measurements to accurately reflect the vehicle-body response. As shown in Figure 4 , an empirical-based correction function was obtained from a laboratory vibration test and validated using real-world vehicle response data. This study found that the mountings amplify the signals in a 7-20 Hz frequency band, depending on their arm length and rigidity, while attenuating the amplitudes of vibrations above 30 Hz. The proposed method reduces the differences caused by different mountings through amplitude correction in frequency bands
Figure 4: Schematic flowchart of the mounting correction method
3.1 Laboratory vibration experiment
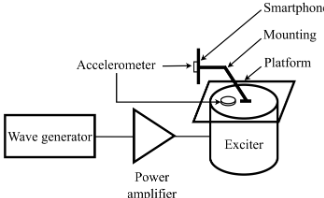
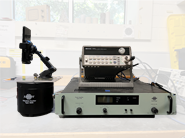
The experimental set-up comprises the smartphone-mounting system, a dedicated accelerometer, vibration instruments, and a flat mounting platform. The vibration instruments include a waveform generator, a power amplifier, and a vibration exciter that is predominantly used for calibrating accelerometers. The vibration signal was first created in the wave generator, then passed to the amplifier. The amplifier increases the power of the signal so the exciter moves vertically in a pattern that reflects the generated signal. Connected to the exciter, the flat platform provides a base for the smartphone mountings to sit on. The platform was fastened to the exciter using screws, ensuring the effective transfer of vibrations. The schematic representation and a photo of the actual set-up are shown in Figure 5 (a) and (b) respectively.
(a)
(b) Figure 4: Schematic flowchart of the mounting correction method
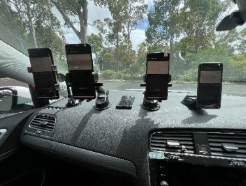
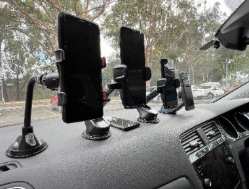
As shown in Figure 6, four different smartphone-mounting systems were installed on the dashboard of the vehicle cabin using a suction mount, while the smartphone that collects the reference signal was mounted to the dashboard using double-sided tape.
Vehicle
Smartphones front view
Smartphones side view Figure 6: In-cabin set-up
3.2 Validation of the mounting correction function
The bandpower plots for the full 1.05 km of response data were calculated for each mounting type to demonstrate the performance of the correction function.
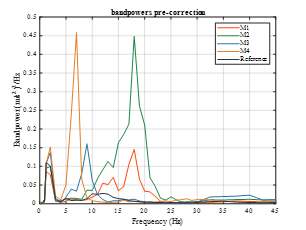
Before correction. As illustrated in Figure 7(a), the dashboard reference (in grey) exhibits consistently lower bandpower amplification across all frequency ranges compared to smartphones mounted on various arms. Each mounting setup amplifies vibrations most prominently within a specific frequency range, generally between 5 and 25 Hz. Specifically, the short and medium length arms exhibit strong amplification around 17 Hz, while the longer and flexible arms peak in the bands of 9 Hz and 7 Hz, respectively.
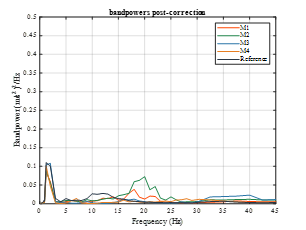
After correction, the recalculated bandpowers, shown in Figure 7(b), indicate that the previously high peaks have been successfully reduced and now align more closely with the reference signal. Variations in bandpower among the different arm mountings are significantly lower. In particular, all four mount types show a greater consistency with the reference within the 0–10 Hz range, with no major peaks or dips. However, some discrepancies remain: the medium length arm shows elevated bandpower in the 15–25 Hz range; and the short arm still peaks in 17 Hz. Overall, the correction function effectively lowers the Root Mean Square Error across each of the setups, reducing the deviation from the reference data set and enhancing the accuracy of the responses in relation to the vehicle body’s behaviour, regardless of the mounting configuration.
(a)
(b) Figure 7: Bandpower of the signal from mounted smartphones – pre correction (a); post correction (b)
4. Develop a profile estimation method considering vehicle specifications
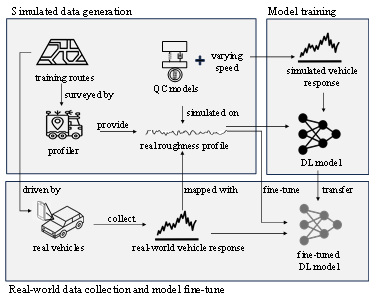
The previous section investigated and quantified the impact of the mounting mechanism on the vehicle response to the pavement profile measured by the smartphone. This section aims to address another critical factor that introduces a significant amount of uncertainty into the measurements made by the smartphone: vehicle type. To develop a robust roughness characterisation method, it is essential to investigate the impact of vehicle type on response data collection and to develop a roughness profile estimation method based on vehicle body response. As demonstrated in Figure 8, this section presents a method for reconstructing the roughness profile that considers the vehicle specification. Real-world speed and roughness profiles, and simulated vehicle responses, were used in the training and validation procedures.
Figure 8 Schematic flowchart of the vehicle-based roughness profile estimation
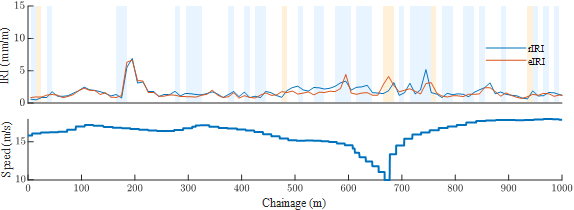
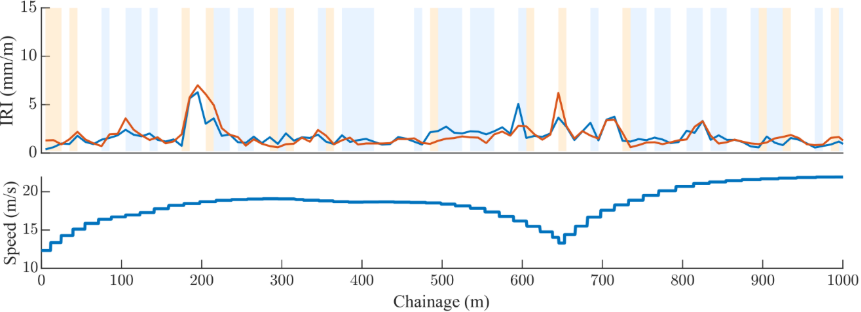
The IRI of the estimated profiles across a 1000 m segment of the testing route is demonstrated. With a reporting length of 10 m, Figure 9 presents IRI measurements for two different vehicles (Sedan and SUV) traversing the same road section versus their respective reference profile. The colour shading indicates the percentage of differences between the estimated IRI (eIRI) and the real IRI (rIRI), with the blue indicating differences of > 10 % and the orange indicating > 20%. Where there is no shade, it suggests a < 10% difference between the two.
In general, the eIRI shows a high level of agreement with the rIRI, with no drastic differences between the two vehicles’ performances. Notably, the two eIRIs pick up the peak at chainage 200 m, as well as the moderate peaks at chainage 600 - 800 m. Meanwhile, the eIRIs correlate well with the rIRIs in the < 5 IRI segment, including chainage 0 - 150 m, 250 - 600 m, and > 750 m. It was also noted that the changes in speed do not affect the accuracy, though noticeable deviations are shown in the 600 - 800 m segment where there is a significant speed drop. Judging by the shaded background, the performance of the two vehicles across the entire testing route is close, as evidenced by the similar R2 values in the range of 0.58 to 0.65. Nonetheless, it is worth noting that a significant deviation happens at chainage 650 m for both vehicles. In fact, similar deviations happen along the testing route occasionally. This is likely due to the unusual measurements in the response sequence, attributed to factors beyond the roughness conditions.
Figure 9 Estimated IRI from the vehicle response (above SUV; below Sedan)
5. Conclusion
The modern methods of roughness monitoring aim at engaging public drivers, with vehicle-mounted smartphones used to collect response data from public vehicles. While a number of existing studies have developed methods of estimating the roughness index from the smartphone-collected response data, the issue of practical uncertainty has not been addressed. The accuracy and consistency of the current smartphone-based approaches are affected by practical factors including speed, vehicle type and mounting configuration. Our work aims to understand how variations in different practical factors affect the smartphone-collected vehicle response data, and to develop methods of mitigating such impacts and characterising roughness conditions more accurately.
First, an evaluation framework was developed to validate smartphone-based roughness index estimation (sRIE) systems, introducing 6 metrics to assess their accuracy and consistency. Field tests on three commercial sRIE Apps revealed that their R-squared values against the ground-truth IRI ranged from 0.5 to 0.7, indicating significant limitations in robustness against mounting and vehicle variations. We then focused on understanding the impact of smartphone mounting on collecting vehicle response data. Empirical-based correction function was obtained from a laboratory vibration test and field validated using real-world smartphone-collected responses. The correction of the 4 typical mounting configurations provides a viable approach to mitigate the mounting's impact on transferring vehicle body response data, as evidenced by bringing down the powerbands of the smartphone-mounting systems closer to that of the reference signal. Next, the vehicle factor was studied. The variation of the vehicle model imposes variations to the vehicle collected response excited even by the same roughness profile and, as a result, causes inconsistency in the estimated roughness index. Therefore, our research aims to accommodate the vehicle factor by taking into account the vehicle specification in estimating the roughness index. The estimated IRI reached an R2 of 0.72 compared to the reference IRI.
The research contributes to the body of knowledge of accelerometric-based pavement roughness characterisation by: 1) providing a comprehensive evaluation framework for sRIE systems; 2) developing correction functions to mitigate mounting's interference in practical data collection and; 3) proposing a roughness profile reconstruction approach considering vehicle specifications. Ultimately, this study advances pavement condition monitoring by integrating ubiquitous sensing and public vehicles.
References
Yu, Q., Fang, Y., & Wix, R., 2023, ‘Evaluation framework for smartphone-based road roughness index estimation systems’, Int. J. Pavement Eng., vol. 24, no. 1, doi: 10.1080/10298436.2023.2183402.


%20Yu.jpeg)