ARRB was able to help Mornington Peninsula Shire Council (MPSC) demonstrate to its stakeholders, community and project funders that their investment was well made, delivering significant traffic and economic benefits.
ARRB was able to help Mornington Peninsula Shire Council (MPSC) demonstrate to its stakeholders, community and project funders that their investment was well made, delivering significant traffic and economic benefits. This was shown through a combination of interview techniques, traffic data analysis and economic modeling and assessment. MPSC has a track record in innovating in the transport arena, so we look forward to working together in the future, and helping local traders and visitors have a great day out at the beach.
Introduction
Most Australians associate summer with school holidays, major outdoor sporting events and long summer days.
Many also remember childhood visits to the beach, which promised a day of sun, fun, surf and sand. For our forbearing parents, there was an additional dimension less looked forward to, that of driving around in the hot sun looking for a parking spot close enough to the beach of choice to avoid complaints and to allow easy ferrying of beach paraphernalia to and from the beach.
Mornington Peninsular Shire Council (MPSC) were aware of this potential barrier to visitors; with beaches all along the Port Phillip Bay coastline, there was a need to ensure a high market share of visitors was maintained for the local economy.
MPSC therefore approached the Federal Government through the Smart Cities and Suburbs Program and secured funding for a demonstration project titled The Mornington Peninsula Smart Parking and Amenities at High-demand Areas. Using Rye as the demonstration township, the idea was to address growing demand on parking and amenity facilities in towns with particularly high number of tourist attractions, and in so doing be more attractive a destination than neighbouring areas.
A critical part of the project was an evaluation of the outcomes; would future investment in the concepts and technologies trialled deliver the transport outcomes desired?
ARRB was engaged by the Mornington Peninsula Shire (MPS) to answer this question in order to ascertain the project outcome and its impact on the community.
This article gives an overview of what MPS implemented, how the effectiveness was evaluated and the findings of this evaluation.
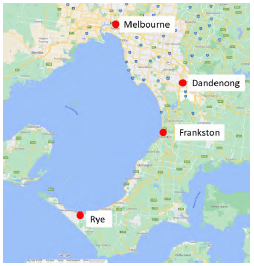
Figure 1 Geographic context of Rye. Source Google Maps 2020, ‘Rye, Victoria’, map data, Google, California, USA.
The Implemented System
Rye is located towards the Southern end of the Mornington peninsula and is a popular destination for day trips from Melbourne’s Eastern and South Eastern Suburbs. It is roughly 100km from Melbourne’s CBD by road. Its location relative to nearby major centres is shown in Figure 1.
The critical components of the scheme were
Vehicle detection sensors – dual infra-red and magnetic sensing – in car parks
Associated data aggregators and distributors
Variable Message Signs (VMSs) located on the major routes into the precinct advising of parking availability
ARRB’s Evaluation of The Scheme
ARRB was engaged to provide the overall project evaluation to ascertain the project outcome and its impacts on the community. A before-after comparison was designed and conducted to assess the following expected outcomes of the project:
Evaluate the impacts on the community of installing a smart parking management package, including smart parking signage and parking app as a key as well as smart parking sensors
Support the development of business cases, i.e. expand the pilot project to the broader council area in the future
Support sustainable funding to maintain the smart parking and pedestrian facilities.
The ‘before’ and ‘after’ periods are defined as follows:
‘Before’ period (March 2019): Saturday 9 March until Monday 18 March 2019
‘After’ period (March 2020): Saturday 7 March until Monday 16 March 2020.
Additional ‘after’ data was also collected during the January peak season - Saturday 18 January until Monday 27 January 2020 - to enrich the assessment and provide insight into a busier period of the year compared to March.
The following data collection and evaluation methods were applied:
Evaluation of the project success based on the intercept survey data obtained from road users in March 2019 and March 2020 (before-after comparison)
Evaluation of the project success based on traffic data (including vehicle speeds and volumes) in March 2019 and March 2020 collected from tube counters installed in key locations in Rye (before- after comparison)
Evaluation of additional ‘after’ data obtained during the peak-season weekend in January 2020 (both survey and traffic data), and comparison to March 2019 data
Assessment of impacts of the parking and traffic situation on local retailers and drivers/passengers.
Survey Design and Data Collection
In consultation with the project board members and MPS experts, ARRB developed an intercept survey questionnaire that covered a set of key questions. Respondents were asked about their perception of the traffic and parking situation in Rye town centre (e.g. time savings, perceived congestion, safety) and how they felt about the amenities in the area. The questionnaire also included some background and demographic questions (age, purpose of travel, visitor or resident etc.). It was expected that the subjects would spend 10–15 minutes to complete the survey.
The intercept surveys were conducted in March 2019 and March 2020 targeting as many people as possible within the survey period at Rye town centre and foreshore. The survey covered nine observational sites. Survey hours were from 10 am to 6pm.
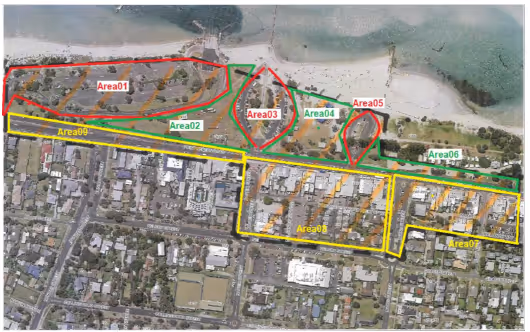
The surveys were conducted on the Saturday and Sunday of the Labour Day long weekends (‘before’: 9 and 10 March 2019; ‘after’: 7 and 8 March 2020). It was intended to collect data on busy weekends where high demand for parking is usually observed. A total of nine areas at the foreshore park and town centre were covered (see Figure 2), and a total of 246 respondents were surveyed.
Tube Counter Data Collection
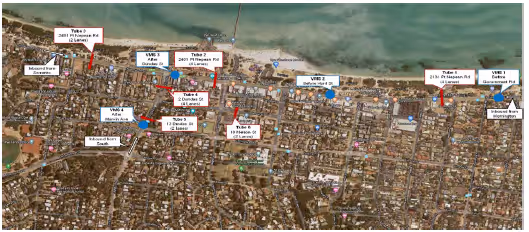
The six sites in Rye where tube counters were installed were:
The eastern and western tube on Point Nepean Road (tubes 1 and 3) as well as the southern tube on Dundas Street (tube 5) captured traffic entering or leaving Rye on the three main roads leading east, west and south.
Additional tubes were installed within Rye on Point Nepean Road near the town centre (tube 2), on Dundas Street near the intersection with Point Nepean Road (tube 4) and on Nelson Street near the Nelson Street parking area (tube 6).
For each of these locations, data - Vehicle volumes, speeds and vehicle composition - for both directions of travel was obtained.
The tube location and location of VMS are shown in Figure 3.
Figure 2 Areas in which intercept surveys were conducted. Source Austraffic (2019).*Note: Red areas: foreshore car parks; green areas: foreshore pedestrian zones; yellow areas: streets and town centre.
Figure 3 Location of traffic counting equipment and VMSs. Source Google Maps 2020, ‘Rye, Victoria’, map data, Google, California, USA.
Key Findings
Findings From The Intercept Survey
Respondents generally saw improvements during both ‘after’ periods (January 2020 and March 2020) compared to the ‘before’ period (March 2019). This includes less time spent to find parking, increased easiness to find parking and lower perceived congestion levels. Even in January 2020, improvements in major surveyed questions were also noticeable in the survey data despite high peak season traffic volumes. The highlighted findings are:
The percentage of respondents who spent more than 5 minutes to find a parking spot dropped from 31% in March 2019 to 14% in January 2020 and further down to 3% in March 2020. The percentage of people who spent more than 10 minutes to find a parking spot dropped from 15% in March 2019 to 6% in January 2020 and down to 0% in March 2020.
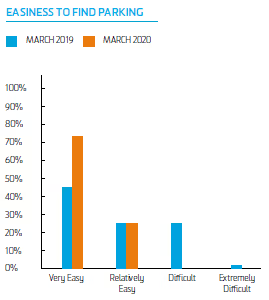
In March 2019, 26% of the respondents reported it was difficult or extremely difficult to find a parking space, whereas in January 2020 this figure dropped to 12%. By March 2020, no one found parking difficult.
In March 2019, 48% of the respondents reported they experienced medium to heavy congestion when driving through the town centre. This figure dropped to 30% in March 2020.
The vast majority (> 90%) of respondents thought that parking was safe. There was no considerable change between March 2019, January 2020 and March 2020. Only a few respondents had some concerns or thought it was dangerous (valuables stolen from car, narrow parking spaces, more cameras required to monitor the situation).
When asked about their suggestions for how to further improve parking in Rye, in March 2019, more than half of respondents (55%) suggested that more parking spaces were required, especially on busy days during the peak season. This figure was only 20% in January 2020 and down to 15% in March 2020. Other suggestions included better car park design and more parking guidance
The parking guidance VMSs were considered helpful by both visitors and locals. In January 2020, 55% of the respondents noticed the signs when driving into Rye, and 40% of them stated that the signs did help them to find parking faster. By March 2020, 62% of the respondents reported that they saw the parking signs when driving into Rye, and about half of them (49%) stated that the signs did help them to find parking faster. However, both January and March 2020 surveys showed that the parking app was not used or the respondents were not aware of it.
Figure 4 Examples of changed perceptions of interviewees inintercept surveys (time spent to find parking)
Findings From The Traffic Report
Traffic volumes and speeds were collected from six tube sites along Point Nepean Road, Dundas Street and Nelson Street for both the ‘before’ period (9 March to 18 March 2019) and two ‘after’ periods (18 to 27 January 2020 and 7 to 16 March 2020). The key findings were:
Traffic volumes increased during both ‘after’ periods (January and March 2020) compared to the ‘before’ period (March 2019). Average weekend volumes in March 2020 were 2.3% higher on average than in March 2019. In January 2020, they were 26.9% higher, i.e. considerably higher traffic volumes were recorded during the peak season period in January 2020 compared to March.
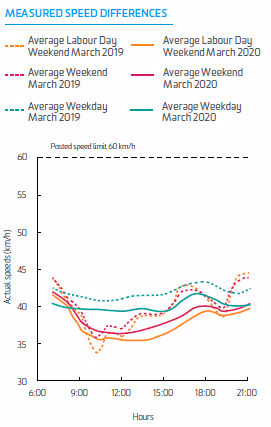
Mean speeds decreased slightly during both ‘after’ periods compared to the ‘before’ period. However, speed decreases were small in March 2020 on the average weekend, and they were mostly statistically insignificant (only 4 out of 12 cases are significant). The speeds dropped more significantly in January, which corresponds to the higher traffic volumes in January compared to March.
The speed variability and CoV of the mean speeds was lower in most cases on weekends during the ‘after’ periods compared to the ‘before’ period (10 out of 12 cases for March 2020 vs March 2019, and 9 out of 12 cases for January 2020 vs March 2019 comparison), despite the increased traffic volumes and lower speeds. The decreased covariance (CoV) indicates a more homogeneous/less variable traffic flow or less stop-and-go type traffic along the major routes, i.e. the traffic flow had improved
Figure 5 Examples of changed perceptions of interviewees inintercept surveys (easiness to find parking)
Figure 6a Examples of measured speed differences Northbound on Dundas street
Figure 6b Simplified examples of measured speed differences Northbound on Dundas street
Economic Outcomes
As stated earlier, supporting the local economy was an important driver of this project, through making Rye a more attractive destination than similar towns by dint of its improved traffic and parking performance. The results described above show that subjectively patrons of the Rye foreshore and shopping precincts felt the smart city project had improved matters, and the tubes showed objectively that their perceptions were based on measurable differences too.
In addition, MPSC wanted to understand if the technology deployed could be used to improve economic outcomes for traders, by ensuring that the occupancy of parking spots was turned over as much as possible; i.e. reducing overstays in order to increase the number of
visitors with access to the shopping precincts. In addition, they wanted to know what travel time savings the system was providing to visitors.
An economic assessment along these lines found that
The potential additional retail revenue for shops in Rye was estimated at A$154 989 for the peak season between mid- December and late-January if parking overstays could be mitigated.
The community saved travel time cost of A$20 037 over two weekend days by reducing the time to find a parking space by just over one minute.
Summary
ARRB was able to help MPSC demonstrate to its stakeholders, community and project funders that their investment was well made, delivering significant traffic and economic benefits. This was shown through a combination of interview techniques, traffic data analysis and economic modelling and assessment. MPSC has a track record in innovating in the transport arena, so we look forward to working together in the future, and helping local traders and visitors have a great day out at the beach.