Reimagining First-Mile Access: A Cost-Neutral Parking Strategy to Promote Public Transport Usage
Poor first-mile access limits public transport use in many urban regions. By changing how parking works, we propose a first-mile solution to increase train ridership and service quality. It is cost-neutral, with generated revenue offsetting the anticipated costs, achieving a net-zero financial impact. Using Wellington Metro Railway Network in New Zealand as a case study, this article evaluates its potential impact on travel modal shift, revenue growth and equity gains, contributing to a more sustainable urban mobility framework.
Poor first-mile access limits public transport use in many urban regions. By changing how parking works, we propose a first-mile solution to increase train ridership and service quality. It is cost-neutral, with generated revenue offsetting the anticipated costs, achieving a net-zero financial impact. Using Wellington Metro Railway Network in New Zealand as a case study, this article evaluates its potential impact on travel modal shift, revenue growth and equity gains, contributing to a more sustainable urban mobility framework.
1. Introduction
Public transport systems are crucial for urban mobility. New Zealand Government (2024) emphasises enhancing them for sustainable urban development. However, connectivity challenges between public transport networks and passenger origins/destinations often deter users, leading to a preference for private vehicles over public transits. Greater Wellington Region features a typical spatial separation between commercial and residential areas. A significant portion of Wellington City employees commute from its outskirts, including Porirua City, Lower Hutt City and Upper Hutt City (Wellington Regional Growth Framework, 2020). Wellington Metro Railway Network covers these major commuting demands.
This study proposes an innovative, cost-neutral parking model for the Wellington Metro Railway Network, focusing on daily commuting. It combines free carpooling facilities and paid single-occupancy parking that charges $5 on weekdays, promoting shared rides to local train stations and regular train commutes. This first-mile solution anticipates additional revenue from paid parking and increased train ridership. This revenue could be reinvested into rail infrastructure maintenance and peak-hour service frequency increases, ultimately supporting a self-sustaining cycle of commuter growth and service enhancements. This concept is globally transferrable to cities with similar spatial characteristics.
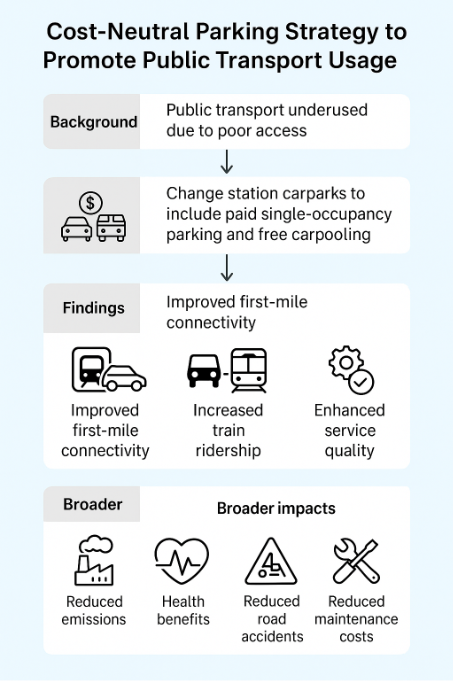
Beyond the rail ecosystem, this proposed solution may be beneficial to easing traffic congestion, lowering carbon emissions, as well as reducing road accidents and maintenance costs (Greater Wellington Regional Council, 2022). Figure 1 illustrates the policy concept. The $5 charge is also illustrative of how this system could work and may be replaced by another amount in real-life practice.
The initial investment to roll out the programme involves the costs for regulatory and policy assessment; smart parking technology, including camera monitoring systems and system integration to support monitoring logistics; signage and road markings to clearly designate carpooling and paid single-occupancy spaces; as well as public-awareness promotion through targeted social media and station-based marketing. The overall cost is estimated to be under NZ$2,000,000 and can be proposed as a small project within the Value for Money (VfM) programme as part of the investment portfolio of NZ Transport Agency Waka Kotahi.
Figure 1: Illustration of the concept of the proposed parking policy
2. Modelling Patronage Fluctuations
The core concept is to transform existing carparks at local train stations into an active policy lever. It encourages commuters to shared riding through cost incentives and increases train ridership through easier station access. It provides rail agencies with a modest, stable income stream to enhance service quality, such as increasing peak-hour frequency without major capital investments.
The rail patronage is studied to obtain an expected patronage trajectory over the next two years without the proposed carpooling intervention. It serves as a baseline for predicting carpool usage fluctuations.
2.1 Analysing Past Patronage
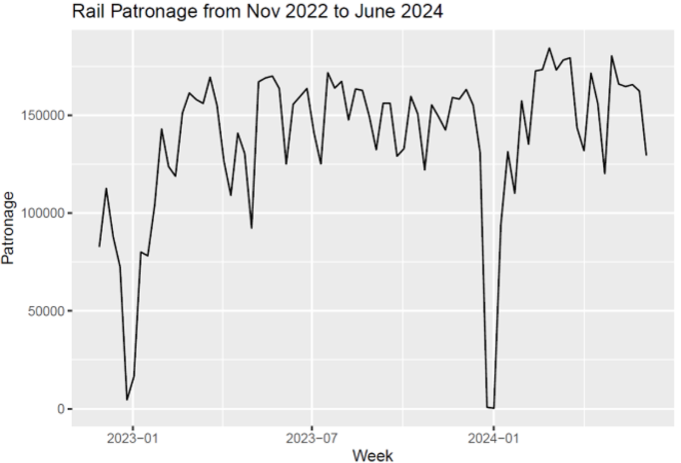
Figure 2 displays weekly rail patronage from November 2022 to June 2024, with troughs during holiday periods. For the rest of the year, the weekly ridership largely remains between 125,000 and 175,000.
A multivariable regression identifies the number of days off work, average atmospheric visibility and rail service reliability during the week, as key drivers of past patronage variations. A local level model with explanatory variables and seasonal component, under the state space time series model schema, captures the unobserved dynamic evolution of patronage over time. It shows that atmospheric visibility resonates with patronage seasonality. Poor visibility reduces train ridership. Rail service reliability also causes patronage fluctuations, though with a more consistent pattern.
Figure 2: Time series plot for past rail patronage
2.2 Predicting Future Patronage
Building on the identified trend and seasonality patterns, a stochastic differential equation model is developed to forecast future rail patronage. It leverages underlying historical noises to account for stochastic fluctuations without explicitly requiring future data. This feature is critical due to the unavailability of future weather and rail performance data.
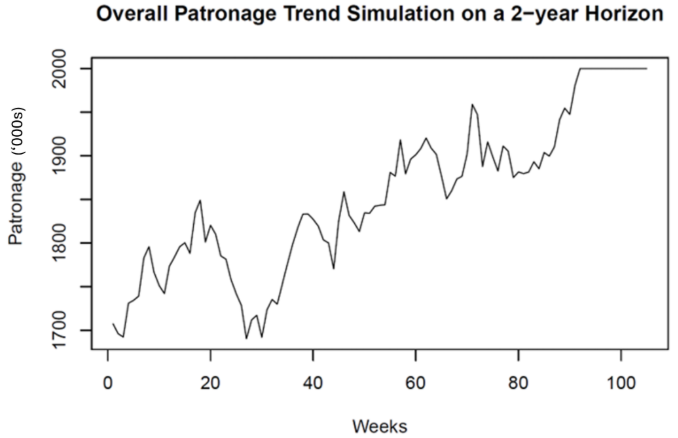
Without the carpooling intervention, Figure 3 forecasts a generally increasing trend of rail patronage over a two-year horizon. The weekly patronage is predicted to be largely between 170,000 and 200,000. Patronage shown in the figure was scaled for parameter interpretability.
Figure 3: Future rail patronage simulation without carpooling interventions
3. From Parking Spaces to Behavioural Shifts
The 2018 New Zealand Census presents population data by main means of travelling to work in each suburb (Statistics New Zealand, 2018). Here, the main commuting means are categorised as train, driving and other. A multivariable regression model has identified that commuters are significantly influenced by cost sensitivity, exceedance probability and additional multimodal commuting time compared to optimal driving.
Cost sensitivity. There are several possible pricing schemes for the existing carparks at local train stations to support multimodal commuting. We define three boundary options:
All carparks are free, assuming all parked vehicles are single-occupancy.
All carparks charge $5 on weekdays, assuming all parked vehicles are single-occupancy.
All carparks are for carpooling passengers only on weekdays, assuming that all parked vehicles are shared by two commuters.
These three boundary pricing schemes are used to determine the cost sensitivity for commuters in each suburb, which measures how significantly their commuting cost responds to price changes.
Exceedance probability. This measures the likelihood of single-modal driving with traffic delays exceeding multimodal commuting time for each suburb.
3.1 Localising Carpool Ratios
Suburbs have distinct commuting characteristics for cost sensitivity and exceedance probability. Thus, segmenting them into groups that share similar characteristics helps tailor the proportion of carpool parks at each local train station.
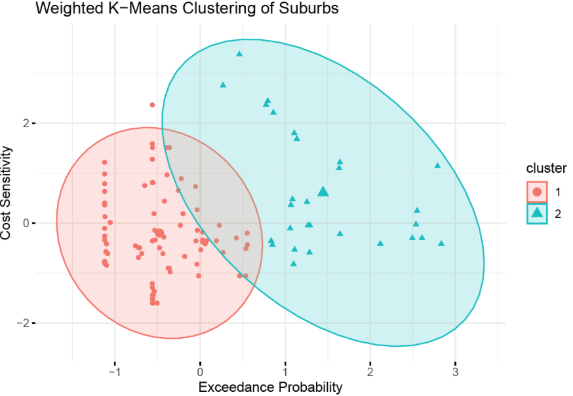
In Figure 4, Cluster 1 (red) suburbs have lower cost sensitivity and exceedance probability, and Cluster 2 (blue) suburbs are to the contrary. Commuters from Cluster 2 suburbs may be more likely to adopt multimodal commuting for cost- and time-savings, suggesting more free carpool parks at their local train stations may be more effective in expanding railway usage.
Figure 4: Two clusters of suburbs of distinct commuting characteristics
Strategically, local train stations for suburbs in Cluster 1 and 2 are baselined with 20% and 40% of the carparks converting to carpool parks on weekdays, respectively. The remainders are for single-occupancy carparks that charge $5 on weekdays.
3.2 Forecasting Carpark Usage
In addition to cost sensitivity and exceedance probability, there are other behavioural nuances that impact commuters’ decision making. For example, commuters may not fully perceive vehicle maintenance and fuel costs as part of their daily commuting expenses. They may be discouraged by the coordination efforts to carpool with other commuters (van Kujik, et al., 2022), despite monetary savings. Introducing paid single-occupancy carparks may initially lead to avoidance, such as driving directly to work and working from home. Possible illicit behaviours, such as parking at nearby residential areas, may intensify community dynamics (van Ommeren, et al., 2011). Over time, acceptance may follow as commuters start comparing the options rationally.
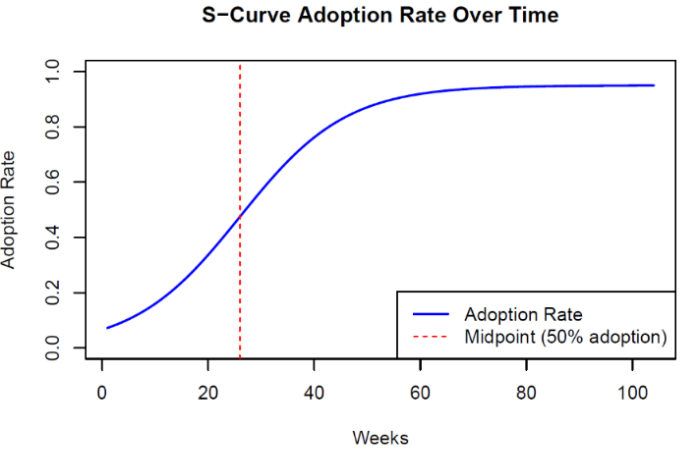
This adoption process of carpark usage is modelled by an S-curve, assuming growth in the first year and stabilisation in the second year, as illustrated in Figure 5.
Figure 5: A defined S-curve carpark adoption rate for each local train station
Commuters in the catchment areas of each station are presented with the following five options: single-modal driving; multimodal commuting with single-occupancy driving to local train stations; or multimodal commuting with carpooling with 1, 2 or 3 other commuters to local train stations. A SoftMax function-based random utility model estimates the probability of commuters choosing each mode, incorporating cost, inconvenience, penalty and randomness. Input of the model includes the number of commuters and available carparks at each station, sourced from 2018 Census and Metlink website, respectively.
The estimated probabilities inform adjustments to baseline carpool ratios: 10% for stations with no significant carpooling incentive influence; 20% for those with limited multimodal commuting choices; and 30%-60% based on the relative proportions between single-occupancy and carpooling commuters.
Adjusted carpool ratios allow estimation of single-occupancy and carpool park usage in the first two years of implementing the proposed parking policy.
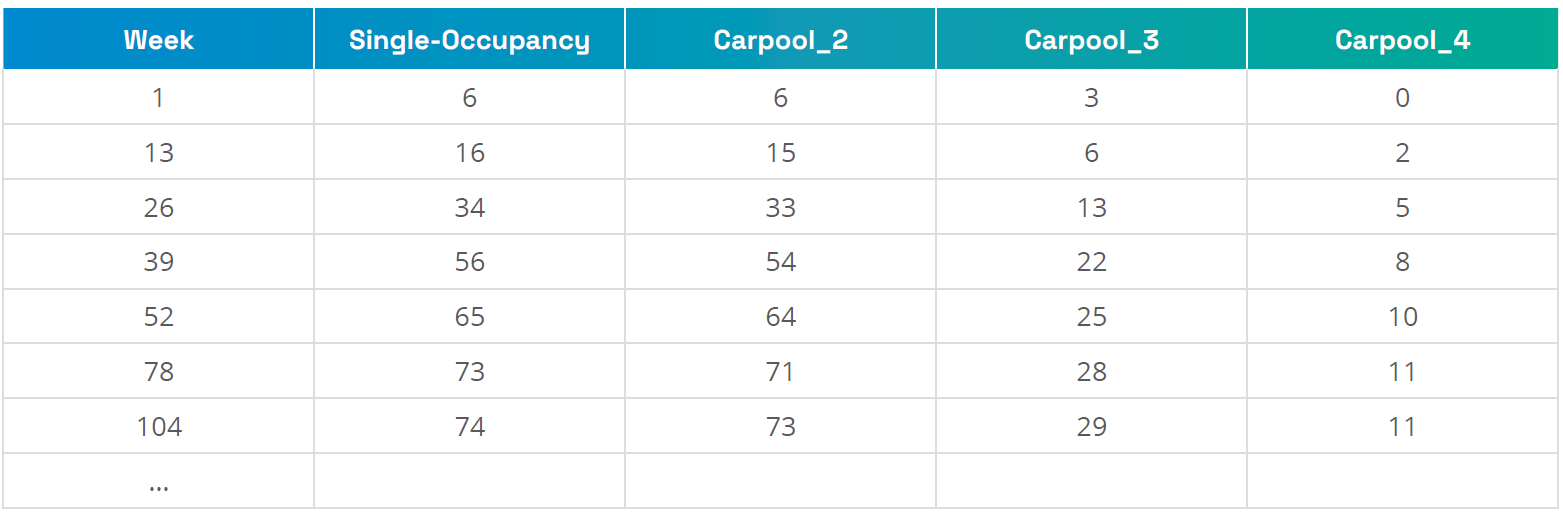
Fluctuating the carpark usage with the rail patronage evolutions modelled in 2.2, the forecasted outcome for a sample station, Melling, is presented in Table 1. There are 187 carparks at Melling Station, with 113 allocated carpool parks and 74 single-occupancy carparks.
Table 1: Forecasted carpark usage for Melling Station in Wellington. Source: R Studio Output
4. From Behavioural Shifts to Service Enhancements and Social Benefits
With the forecasted carpark usage and a $5 daily charge for single-occupancy carparks, the additional revenue from parking fares and increased train ridership in the first two years of this policy implementation is forecasted at $11.58 million. $3.70 million is forecasted in the first year and $7.88 million is in the second year.
To improve the network stability for service frequency increase, it is more cautious to reinvest the $3.70 million from the first year in rail infrastructure upgrades, such as the fragile turnouts and signal systems. The $7.88 million from the second year is to be reinvested in more services.
Following Burdett and Kozan (2006), the absolute capacity of each line can be determined in accordance with various factors, such as the impact of freight services and long-distance commuter services, signalling capacity and dwell times.
The operating cost of Wellington Metro Railway Network is approximately $66.44 per kilometre (Ministry of Transport, 2023). Operational costs for additional trains are estimated by multiplying this unit cost by line segment length.
An optimisation problem is formulated to determine the optimal allocation of additional services. The objective is to maximise the revenue usage. The constraints are the network capacity and the balance of morning and evening services for timetable symmetry. This problem may be solved by integer programming to determine the number of additional services on each line during peak hours.
With these additional services and increased patronage, the following social benefits may be expected:
Environmental sustainability. The reduction of vehicles on roads would lead to the reduction of carbon emissions.
Health benefits. This research addresses the first mile through the carpooling incentive and leaves the last mile for commuters to walk in the city centre. Physical inactivity is a major health concern in New Zealand and walking offers an easy improvement (NZ Transport Agency Waka Kotahi, 2020) to enhance overall public well-being.
Road to Zero. Road to Zero is a previous government’s road safety vision, for which no one in New Zealand should be seriously injured or killed in road accidents (NZ Transport Agency Waka Kotahi, 2021). Encouraging public transport usage reduces private vehicles and traffic density, thereby lowering risk of accidents caused by congestion, driver fatigue and reckless driving, particularly during peak commuting hours.
State Highway maintenance. Reduced vehicle traffic slows pavement deterioration, decreasing the demand for reactive maintenance and positively influencing predictive maintenance. This extends the lifespan of state highway infrastructures, delaying major road renewals and reducing long-term government financial burdens.
5. Closing Remarks and Limitations
Repricing station carparks offers a practical strategy to public transport usage without requiring major capital investments for new infrastructures. It is cost neutral and helps the transport authorities operate under budget constraints. Through behavioural modelling and reinvestment optimisation, the proposed strategy shows potential for public transport systems to attract new users, generate self-sustaining revenues, enhance service frequencies and achieve social benefits.
Though grounded in Wellington data, this framework is highly transferable. It suits cities with a similar spatial structure, where jobs concentrate in the centre and housing sprawls outwards.
Ultimately, a targeted parking policy is key to make public transport more accessible.
A key limitation is the reliance on 2018 Census data, which does not account for post-COVID-19 impacts. Moreover, predictable commuter responses are assumed to the parking modification and service upgrades. However, actual behaviours are influenced by more complex socio-economic factors and personal preferences that are not fully captured. Thus, projected benefits are indicative and will depend on stable commuter behavioural patterns and sustained carpark system adoption.
Since reinvestment decision making is arguably a complex topic, it is simplified in this article as a proposed optimisation problem without precise solutions. Further exploration of investment decision modelling is outside the scope of this article but may be addressed in future work or through integration with the Value for Money (VfM) framework.
Acknowledgements
This article is based on the research conducted by the author as part of her Master of Mathematical Sciences at the University of Canterbury. The research is supported by NZ Transport Agency Waka Kotahi through 2024 Transport Research Masters Scholarship.
The author would like to thank Dr. Heyang (Thomas) Li of the University of Canterbury for his supervision of the master’s research and shaping the contextual framework. The author is also grateful to Chris Vallyon of NZ Transport Agency Waka Kotahi for his governance perspectives, and to Peter Lensink and Brandon Robins of Transdev Australasia for their industry insights.
The author acknowledges Transdev New Zealand for access to data used in the supporting analysis.
While the author is employed at the NZ Transport Agency Waka Kotahi and Transdev New Zealand, the expressed views are those of the author and do not necessarily represent the views of the organisations.
References
Burdett, R. L., & Kozan, E., 2006, ‘Techniques for absolute capacity determination in railways’, Transportation Research Part B: Methodological, 616-632. doi:10.1016/j.trb.2005.09.004
Greater Wellington Regional Council, 2022, ‘Wellington Rail Programme Business Case - Wellington Strategic Rail Plan’, Retrieved from https://www.gw.govt.nz/assets/Documents/2022/08/Wellington-Rail-Programme-Business-Case-Wellington-Strategic-Rail-Plan.pdf
Ministry of Transport, 2023, ‘Domestic Transport Costs and Charges Study’, Retrieved February 24, 2025, from https://www.transport.govt.nz/assets/Uploads/DTCC-WP-C12-UPT_June-2023.pdf
Ministry of Transport, 2023, ‘Road to Zero Quarterly Progress Report (January to March 2023)’, Retrieved March 1, 2025, from https://www.transport.govt.nz/assets/Uploads/2023-03-Road-to-Zero-Ministerial-Oversight-Group-Quarterly-Report-January-March-2023-Redacted.pdf
NZ Transport Agency Waka Kotahi, 2020, ‘Benefits of Walking’, Retrieved October 20, 2024, from NZ Transport Agency Waka Kotahi: https://nzta.govt.nz/walking-cycling-and-public-transport/walking/walking-standards-and-guidelines/pedestrian-network-guidance/walking-in-new-zealand/benefits-of-walking/
NZ Transport Agency Waka Kotahi, 2021, ‘2021-24 National Land Transport Programme’, Retrieved March 1, 2025, from https://www.nzta.govt.nz/assets/planning-and-investment/nltp/2021/NLTP-2021-24.pdf
NZ Transport Agency Waka Kotahi, 2024, '2024-27 National Land Transport Programme’, Retrieved July 13, 2025, from https://nzta.govt.nz/planning-and-investment/national-land-transport-programme/2024-27-nltp/
NZ Transport Agency Waka Kotahi, 2024, ‘Monetised benefits and costs manual’, Retrieved March 1, 2025, from https://www.nzta.govt.nz/resources/monetised-benefits-and-costs-manual
NZ Transport Agency Waka Kotahi, 2024, ‘New Zealand vehicle fleet open data sets’, Retrieved September 30, 2024, from https://nzta.govt.nz/resources/new-zealand-motor-vehicle-register-statistics/new-zealand-vehicle-fleet-open-data-sets/#data
Ritchie, H., 2023, ‘Which form of transport has the smallest carbon footprint?’, OurWorldinData.org. Retrieved September 30, 2024, from https://ourworldindata.org/travel-carbon-footprint
Statistics New Zealand, 2018, ‘2018 New Zealand Census’. NZ.Stat., New Zealand
Statistics New Zealand, 2022, ‘ArcGIS Web Application’, Retrieved February 26, 2022, from https://statsnz.maps.arcgis.com/apps/webappviewer/index.html?id=6f49867abe464f86ac7526552fe19787
Statistics New Zealand, 2023, ‘2023 New Zealand Census’, Aotearoa Data Explorer, Retrieved October 28, 2024, from https://explore.data.stats.govt.nz/
van Kuijk, R. J., de Almeida Correia, G. H., van Oort, N., & van Arem, B., 2022, ‘Preferences for first and last mile shared mobility between stops and activity locations: A case study of local public transport users in Utrecht, the Netherlands’, Transportation Research Part A: Policy and Practice, 166, 285-306. doi:10.1016/j.tra.2022.10.008
van Ommeren, J., Wentink, D., & Dekkers, J., 2011, ‘The real price of parking policy’, Journal of Urban Economics, 70(1), 25-31. doi:10.1016/j.jue.2011.02.001
Wellington Regional Growth Framework, 2020, ‘Employment Analysis’, Retrieved from https://wrlc.org.nz/wp-content/uploads/2024/03/WRGF-Employment-Analysis-Report-0.6-1.pdf
%20Wen.jpeg)