
Issue 3
The Australian Road Research Board (ARRB), now operating as the National Transport Research Organisation (NTRO), recently pioneered the application of road survey technology to airports. ARRB’s established expertise in road survey technology has a long history of innovation and improvement to provide a repeatable assessment of the condition of roads. ARRB’s fleet of over ten dedicated survey vehicles, including national survey vehicles, unsealed road survey vehicles and now three flagship iPAVE vehicles, regularly measures the condition of roads across Australia, with thousands of kilometres covered in the last year. The specialised laser equipment, gyroscopic measurement and high-quality images are the backbone of many road agency asset management systems and provide valuable insights to network management.
Airport asset management includes a condition assessment of the runway and taxiways and in 2022 ARRB worked with Airport Consultancy Group and Essendon Airport to bring road technology advantages to airports (Simpson & Shackleton 2022). Condition assessments at airports rely on manual measurements made by experienced surveyors. Conventional airport assessment requires a team of surveyors to inspect the runway and taxiway using a grid pattern and taking measurements in each grid. This means the runway or taxiway must be shut down for all air traffic while the survey team is working in the area. And the shut-down must occur during daylight to enable visual survey for the team – which is the busiest time for airport traffic.
As part of the work conducted in 2022, ARRB provided both a conventional specialist visual assessment and an automated survey using iPAVE. The iPAVE survey provided the following additional benefits:
ARRB completed both the visual manual survey and the automated road survey of parts of the airport within the following timescales. The manual survey, of about 10% of a runway, required a half-day shut-down of the area. The iPAVE survey, of 100% of a runway, was also completed in a half-day, with no pedestrian workers and with the capacity to quickly move on and off the runway to allow priority air traffic to use the area, clearly showing the benefits of the iPAVE technology.
The conventional survey includes a visual and manual measurement of parts of the runway. Depending on the condition of the area, 10% to 25% of the area is surveyed. The survey uses a standard to rate 17 different conditions:
Although the rating system is specific, it’s time consuming and not necessarily repeatable because some of the assessments are subjective. The measurement of depressions requires a 3 m straightedge and measurement of the area of the loss of shape. Even setting out the grid pattern for the survey is time-consuming when runways are over 1000 m long and often over 20 m wide.
The survey results in 17 rated conditions and then requires a series of calculations using 19 different adjustment graphs to provide a condition result for each surveyed area, and then an overall condition rating using two optional systems, for the runway.
The conventional survey is detailed and can be considered subjective, time intensive for the surveyors, requires significant closure time for the active runways and taxiways, and provides measured results for only part of the surveyed area. The conventional survey method has been in use for many years and was developed when automated survey equipment was not available.
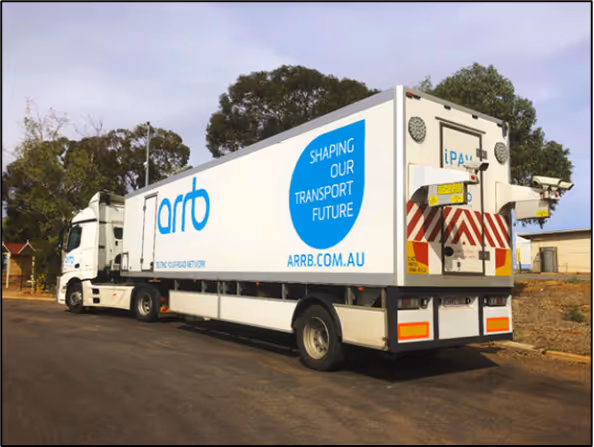
ARRB’s iPAVE (Figure 1) road survey technology measures roughness, rutting, cracking, surface texture and deflection. ARRB’s survey fleet measures road condition all over Australia. The vehicles are fitted with digital laser profilers and digital imaging systems, which allow the vehicles to automatically capture road condition data at normal highway speeds.
The vehicle is equipped with seven cameras, all calibrated to measure road inventory and defect lengths and/or areas. The camera views include front centre, front left, front right, left side, right side, rear and pavement-facing ones. All images are captured at 5 or 10 m intervals. The vehicle also uses laser scanners and point lasers capable of covering a 4 m transverse profile of the road to measure pavement rutting over the full width of the lane.
Rutting is a measurement of the transverse profile of a road. A rut is a depression usually occurring in one or both wheel paths. Rutting is a defect that affects road safety and is used as an indicator of the structural strength of pavement. Rutting can lead to ponding in the wheel paths, which in turn could cause a safety hazard and/or damage the underlaying pavement layers once water finds a way to seep through. It is a permanent, traffic-associated defect that usually increases with increases in heavy vehicle traffic loading.
Roughness, also known as ride quality, rideability or smoothness, is a common objective measure of the general condition of the road. It relates to how comfortable the road is to drive on. Roughness is commonly measured as the longitudinal profile in both wheel paths in a selected lane.
Cracking is a pavement defect signified by splitting of the pavement material due to the action of traffic loading, environmental stress or flaw in material characteristics. It is usually identified as visible discontinuities at the surface, not necessarily extending through the entire thickness of a member or pavement. There are three main types of cracks: transverse, longitudinal and crocodile. A longitudinal crack is parallel to the road centrelines. A transverse crack is a crack at right angles to the road centreline. Crocodile cracking is interconnected cracks forming a series of small blocks resembling a crocodile’s skin or chicken wire, normally caused by excessive deflection of the surface over unstable/weak subgrade or lower courses of the pavement (Austroads 2015).
Texture depth refers to the amplitude of deviations from the surface plane of the road and is influenced by the size, shape and spacing of the aggregate of the surfacing material (Austroads 2009).
The road survey technology provides a different set of information:
The runway was surveyed using several individual runs to ensure the entire width of the area was covered.
The two sets of results for the areas showed similar condition, although comparing results is not straightforward. As an example, the manual results reported:
Meanwhile, the automated survey results for the same areas as the manual survey reported:
Each of the automated data points can be pinpointed to the location using the geographic co-ordinates recorded with the data. This allows mapping of the results to identify any areas of concern.
The ARRB project allows a comparison of the conventional manual survey of airports with automated surveys using newer technology. The automated survey provides a much greater depth of information, repeatable and measurable results and panoramic images at every 5 m. The automated survey provides a safer working environment for the survey staff to remain in vehicles, rather than be pedestrian workers, and requires far less shut-down time for the airport.

.avif)